Daily localization of partial breast irradiation patients with three-dimensional ultrasound imaging
Article information

Abstract
Purpose
Accurate localization of the lumpectomy cavity during accelerated partial breast radiation (APBR) is essential for daily setup to ensure the prescribed dose encompasses the target and avoids unnecessary irradiation to surrounding normal tissues. Three-dimensional ultrasound (3D-US) allows direct visualization of the lumpectomy cavity without additional radiation exposure. The purpose of this study was to evaluate the feasibility of 3D-US in daily target localization for APBR.Materials and methods: Forty-seven patients with stage I breast cancer who underwent breast conserving surgery were treated with a 2-week course of APBR. Patients with visible lumpectomy cavities on high quality 3D-US images were included in this analysis. Prior to each treatment, X-ray and 3D-US images were acquired and compared to images from simulation to confirm accurate position and determine shifts. Volume change of the lumpectomy cavity was determined daily with 3D-US.
Results
A total of 118 images of each modality from 12 eligible patients were analyzed. The average change in cavity volume was 7.8% (range, -24.1% to 14.4%) on 3D-US from simulation to the end-of-treatment. Based on 3D-US, significantly larger shifts were necessary compared to portal films in all three dimensions: anterior/posterior (p = 7E-11), left/right (p = 0.002), and superior/inferior (p = 0.004).
Conclusion
Given that the lumpectomy cavity is not directly visible via X-ray images, accurate positioning may not be fully achieved by X-ray images. Therefore, when the lumpectomy cavity is visible on US, 3D-US can be considered as an alternative to X-ray imaging during daily positioning for selected patients treated with APBR, thus avoiding additional exposure to ionizing radiation.
Introduction
Radiation therapy following breast-conserving surgery is the standard of care in patients with early stage breast cancer. Treatment verification and setup reproducibility of the patient’s breast plays a significant role in maximizing the tumor control achieved with the radiation therapy treatments. Accurate localization of the lumpectomy cavity is essential during daily positioning to ensure that the prescribed dose encompasses the target and avoids unnecessary irradiation to surrounding normal tissues and organs at risk. This is particularly important during accelerated partial breast radiation (APBR) because a higher daily dose of radiation is being delivered as compared to standard fractionation breast treatments. APBR has become increasingly more popular and is now frequently utilized for early stage breast cancer.
Small uncertainties in the daily setup and positioning of patients may lead to discrepancies between the planned and actual delivered radiation treatments. Surgical clips, ultrasound (US), and computed tomography (CT) scans have all been used to aid in localizing the lumpectomy cavity for electron boost planning [1-3]. During the radiation delivery process, MV or kV films are used to properly position the patient in order to align the anatomy as best as possible to the simulation scan geometry that was used for planning the treatment. Although these films are the most commonly employed tool for daily positioning of the patient for treatment, they may not be the most ideal tool because they are matching to bony anatomy rather than cavity to cavity, which is not visible on these images. An alternative method for image-guided verification of the lumpectomy cavity is performing a three-dimensional ultrasound (3D-US) scan, which not only provides direct visualization of the lumpectomy cavity, but also spares any additional radiation to the patient.
While a limited number of studies have reported the use of 3D-US during boost simulation, none have compared 3D-US to X-ray imaging for daily positioning during APBR delivery. We have previously investigated the accuracy of comparing 3D-US images at the time of boost simulation and the initial simulation in patients treated with whole breast radiation [4]. The cavity displacements were not significantly different when calculated based on 3D-US, CT or clips. Berrang et al. [5] demonstrated the usefulness of 3D-US for defining the lumpectomy cavity when co-registered to CT in terms of improved user-variability, suggesting that 3D-US can be a helpful adjunct to CT for planning purposes.
The goal of this prospective study is to compare the accuracy of 3D-US versus X-ray imaging in daily target localization of patients treated with partial breast radiation. To the best of our knowledge, this is the first study evaluating the use of 3D-US imaging during daily positioning of patients treated with APBR.
Methods and Materials
1. Study population
Forty-seven patients with stage I breast cancer were enrolled in this phase I/II Institutional Review Board of University of Vermont Medical Center approved study between June 2006 and February 2016 (No. VCC-0601). The study was conducted in accordance with the principles of the Declaration of Helsinki and all patients were provided written informed consent. Only those patients with visible lumpectomy cavities on high quality 3D-US images were included in this analysis.
2. 3D ultrasound system
3D-US was performed using the Clarity System (Elekta, Stockholm, Sweden). The Clarity System has two 3D-US devices: US-sim in the CT simulation room and US-guide in the treatment room. The CT and 3D-US images were registered through a shared common coordinate system. In practice, 3D-US images acquired prior to each treatment can be compared to US-sim images in order to determine the accuracy of the daily positioning. Fontanarosa et al. [6] have summarized the use of US guidance in radiation therapy, including details regarding the Clarity System.
The breast US probe is linear and has a high central frequency of 9 MHz. The pixel resolution of the images is 0.2 mm. The US probe has infrared reflective markers affixed to its handle. An infrared camera tracks these markers to determine the position and orientation of each US frame. These frames are used to form a 3D voxel. All images are sent through a central server to the Clarity Workstation, which allows contouring and definition of the reference volume.
3. CT and 3D-US simulation
The standard procedure for CT simulation was conducted with patients positioned supine with both arms raised above the head on a breast board with Vacloc immobilization. All patients received initial planning CT scans and fiducials (metallic BB’s) were placed at the external lasers for identification of the simulation isocenter. No respiratory control was applied during CT simulation. Immediately after the planning CT scan, 3D-US images of the lumpectomy cavity were acquired with the Clarity System. A generous amount of high-viscosity ultrasound gel was used during each US imaging in order to decrease the probe pressure and avoid displacement of the lumpectomy cavity to maintain the same position between CT and US images.
4. Treatment planning
Based on the planning CT scan, both breasts, both lungs, and the heart were contoured. The lumpectomy cavity was contoured independently both on planning CT and planning 3D-US. CT images were contoured on the treatment planning system (Pinnacle; Philips Medical Systems, Cleveland, OH, USA) and 3D-US images were contoured on the Clarity Workstation using semi-automatic contouring tools. Two separate observers contoured the cavities on the two different modalities without reference to each other. Based on the planning CT, the clinical target volume (CTV) was defined as the excision cavity + 1.0 cm (5 mm from the skin surface and pectoralis muscle). The planning target volume (PTV) was a 0.5 cm expansion around the CTV. The final PTV was modified to exclude the first 5 mm of tissue from the skin surface as well as any portion extending into the lung. Intensity-modulated radiation therapy was the treatment technique used for planning via the Philips Pinnacle planning system. Ten fractions of 4 Gy were delivered once daily, 5 days per week, for a total dose of 40 Gy.
5. Daily positioning
X-ray and 3D-US images were obtained prior to daily radiation treatment to determine the accuracy of the positioning. X-ray images were compared to the digitally reconstructed radiograph (DRR) generated from simulation to determine shifts. For each fraction, the reference contour of 3D-US images from simulation was overlaid on each 3D-US image and shifted such that it encompassed the lumpectomy cavity. The shifts determined by the 3D-US images were not used for re-positioning for the treatment. X-ray images were used for further re-positioning if applicable before the treatment. Lumpectomy cavity volume was collected daily with 3D-US and compared to the lumpectomy cavity volume determined from simulation 3D-US images to determine any volume changes during treatment.
6. Statistical analysis
The mean, median, and interquartile range of the shifts in all three dimensions (anterior/posterior, left/right, and superior/inferior) were calculated and are reported. The Wilcoxon signed-rank test was used to determine any significant differences (p < 0.05) between the studied modalities.
Results
1. Lumpectomy cavity visualization and eligibility
Of the 47 recruited patients who underwent simulation CT and 3D-US, one patient withdrew from the study, 13 patients had no 3D-US performed, 3 were excluded because of an unidentifiable lumpectomy cavity on 3D-US images and 18 were excluded due to suboptimal ultrasound image quality. The remaining 12 (26%) patients with visible cavities on high quality 3D-US images were included in this study. A total of 118 images of each modality from 12 eligible patients were analyzed.
2. Change in lumpectomy cavity volume during APBR
The 3D-US defined cavity volumes at the time of simulation were on average 37.6% smaller than those defined on the CT images. At initial simulation, the mean cavity volume measured on CT was 31.4 mL, whereas from 3D-US simulation the mean was only 20.6 mL. On average, the cavity volume decreased by 9.8% for 11 of the 12 patients and increased by 14.4% for the patient #7 on 3D-US when comparing measurements between initial simulation to the last treatment fraction. Percent change in cavity volumes are shown in Fig. 1.
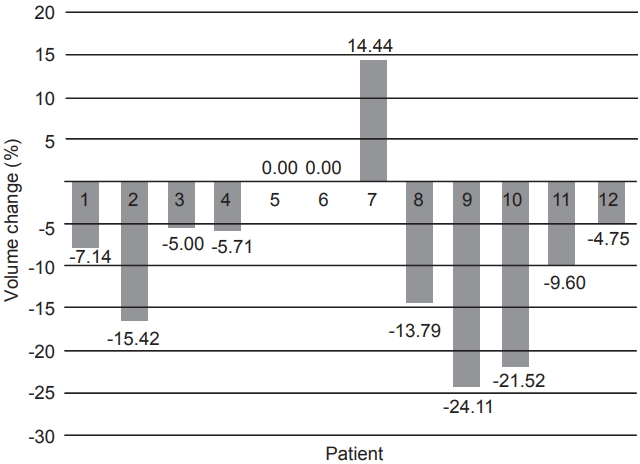
Percent volume change in lumpectomy cavity on threedimensional ultrasound from simulation versus the end of radiotherapy treatment.
3. Lumpectomy cavity displacement during APBR
Data from 118 X-ray images and 3D-US scans acquired were analyzed. The root mean square of all 3D shifts was calculated to determine and compare the overall magnitude of shifts observed between X-ray images and ultrasound. The results are graphically displayed in Fig. 2 and overall demonstrate a significantly larger shift seen with ultrasound imaging (p = 4.7e-15). The median (interquartile range) values for X-ray were found to be 0.3 cm (0.10–0.57 cm) versus for 3D-US were 0.77 cm (0.48–1.09 cm), respectively.
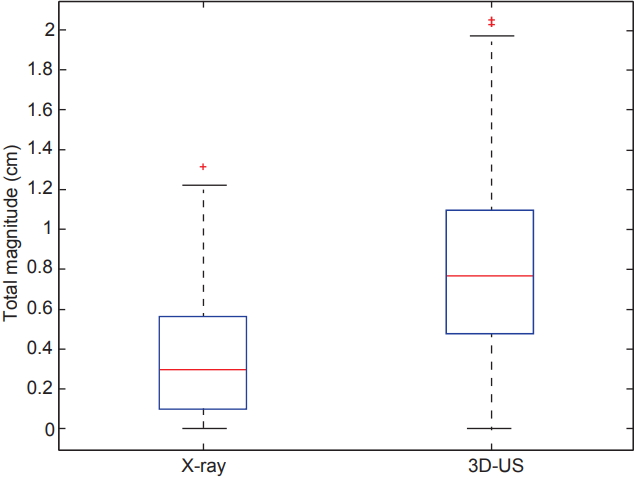
Box plots comparing the distributions of the overall magnitude (i.e., root mean square) of shifts in all three dimensions for X-ray versus 3D-US (p = 4.7E-15). The central red line represents the median, meanwhile the blue edges signify the interquartile range. The whiskers correspond to approximately +/– 2.7σ of the data distribution and values outside are marked with plus (+) signs to represent outliers. 3D-US, three-dimensional ultrasound.
Comparing all of the dimensional shifts individually, 3D-US also demonstrated significantly larger shifts than X-ray images in all three dimensions as seen in Table 1. Box plot data summarizing the distribution per shift dimension is visually displayed in Figs. 3–5 for qualitative comparison purposes.

Comparisons of the shifts determined from X-ray versus 3D-US in each of the three dimensions.
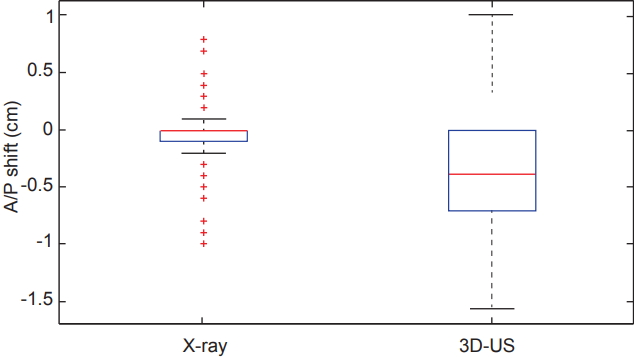
Box plots comparing the distributions of shifts measured in the anterior/posterior (A/P) dimension from both X-ray and ultrasound imaging across the 12 studied patients. 3D-US, three-dimensional ultrasound.
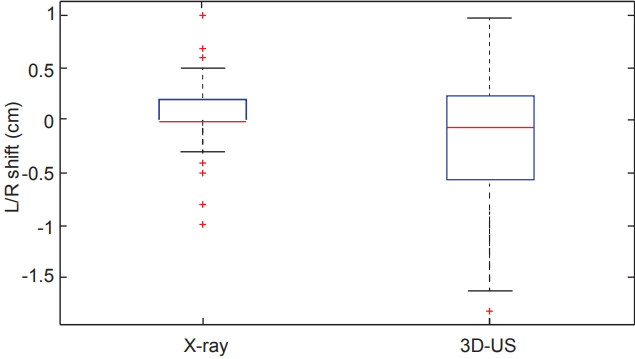
Box plots comparing the distributions of shifts measured in the left/right (L/R) dimension from both X-ray and ultrasound imaging across the 12 studied patients. 3D-US, three-dimensional ultrasound.
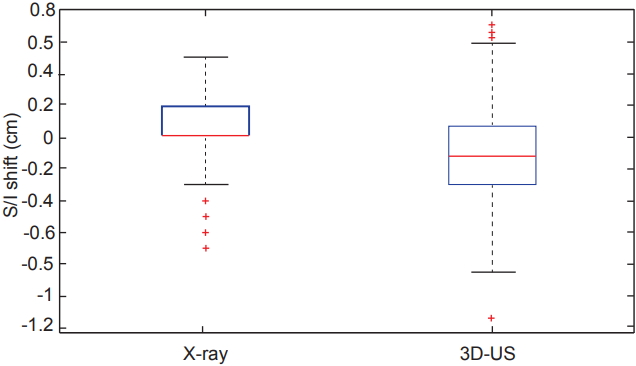
Box plots comparing the distributions of shifts measured in the superior/inferior (S/I) dimension from both X-ray and ultrasound imaging across the 12 studied patients. 3D-US, threedimensional ultrasound.
Furthermore, there was no correlation between the target shifts demonstrated by 3D-US and the change in lumpectomy cavity volume (p = 0.89), patient BMI (p = 0.24) nor breast volume (p = 0.32). Similarly, no correlation was found between the target shifts with X-ray images and the change in lumpectomy cavity volume (p = 0.06), the patient BMI (p = 0.36) nor breast volume (p = 0.63). Median follow-up was 63 months (range, 39 to 89 months). No patient experienced locoregional recurrence.
Discussion and Conclusion
APBR is a convenient treatment option for the selected patient population of women undergoing breast conserving surgery because of its markedly shorter treatment time. Accurate localization of the lumpectomy cavity is especially critical during APBR, since a higher daily dose of radiation being delivered in a shorter period of time. Although X-ray imaging is the most common technique used to determine positioning during daily treatments, it may not be the most optimal due to the lack of direct visibility of the cavity and the additional ionizing radiation delivered to the thorax to obtain the required images. In patients with a visible lumpectomy cavity, 3D-US has been considered as an alternative method to determine target localization prior to the boost treatment, but none have reported its use during daily APBR treatment. In this study, we demonstrated the feasibility of using 3D-US for daily target localization in patients treated with APBR. We observed significant differences between shifts when comparing 3D-US to using X-ray imaging for setup. Ultrasound images demonstrated overall larger shifts than observed from X-ray imaging, indicating that the actual differences in setup of the lumpectomy cavity itself (relative to simulation) may be larger than visualized via the bony anatomy comparison provided by X-ray imaging. This means that there is a potential for target mismatch when relying solely on X-ray images, opening the possibility for clinically significant impacts on the outcomes of this subset of patients receiving APBR. The unique aspects of this study include the use of 3D-US during daily positioning to verify accurate localization target as well as monitoring the changes in cavity volume throughout the course of treatment.
The volume of the lumpectomy cavity was found to be on average 37.6% smaller on 3D-US than on CT. This difference in size is similar to what has been previously reported in the literature. The 3D-US defined lumpectomy cavity volumes are generally smaller, on range 23%–55%, than those defined by CT imaging [5,7]. The likely explanation for the larger cavity volumes depicted on CT, is that fibrotic tissue surrounding the cavities was included when contouring, however only the fluid cavity and seroma were visualized on 3D-US contours, therefore resulting in smaller cavity volumes [8-10]. A change in breast and seroma volume throughout the course of radiation therapy has also been demonstrated previously [11]. This study observed an average decrease of 9.8% in cavity volume across 11 of the 12 patients (one patient showed an increase in cavity size on 3D-us) by the end of the treatment. The overall decrease was correlated with the physiological changes within the treatment site as 3D-US detected seroma shrinkage with time. The increase seen in patient #7 was likely attributed to edema.
A prior study that used surgical clips and CT scans to measure the displacement of the lumpectomy cavity during radiation therapy suggested that the cavity displaces by an average of 3 mm in each direction during radiation therapy [12]. However, another study using 3D-US for daily localization of cavities before boost treatment in breast cancer patients reported the following: compared to the treatment plan, the average absolute lumpectomy cavity displacement was 5.3 mm on anterior/posterior, 5.1 mm on left/right, and 6.2 mm on superior/inferior directions [7]. Another study observed >1.0 cm shifts in 52% of fractions with 3D-US during electron boosts [13]. Given that the amount of cavity displacement was outside of the PTV more than 50% of the time, the authors concluded that the target may not be properly covered in partial breast radiation when no daily image guidance is used. While there are a limited number of studies reporting differences in cavity displacement, this study further confirms that use of daily imaging is essential to deliver the prescribed dose to the disease site, particularly in APBR, given the larger prescribed fractional doses.
The current method of using 2D X-ray images for localization of APBR patients may not be the most optimal approach. Given that the lumpectomy cavity is not directly visible via X-ray images, accurate positioning may not be fully achieved by X-ray imaging. Therefore, when the lumpectomy cavity is visible on ultrasound imaging, 3D-US can be considered as an alternative to X-ray images during daily positioning for select patients treated with APBR, thus improving localization accuracy and simultaneously avoiding additional exposure to ionizing radiation. A potential best practice solution for centers that need to continue relying on X-ray imaging for setup of APBR patients or for those patients where the lumpectomy cavity is not visible on ultrasound, is to consider the use of surgical clips or Biozorb (Focal Therapeutics, Sunnyvale, CA, USA).
Notes
Conflict of Interest
No potential conflict of interest relevant to this article was reported.