| Home | E-Submission | Sitemap | Contact Us |  
top_img
Radiation Oncology Journal > Volume 41(2); 2023 > Article
Choi, Jang, Choi, Lee, and Song: Impact of radiation on immune cells in patients with low-grade brain tumor: Identifying critical factors affecting lymphopenia and neutrophil-to-lymphocyte ratio

Abstract

Purpose

Studies about the effect of radiation therapy (RT) on immune cells are usually limited to a high-grade glioma mostly exposed to chemotherapy and a high dose of steroid which also could affect immune cells. The purpose of this retrospective analysis of low-grade brain tumor patients treated by RT alone is to determine significant factors influencing neutrophil-to-lymphocyte ratio (NLR), absolute neutrophil counts (ANC), and absolute lymphocyte counts (ALC).

Materials and Methods

A total of 41 patients who received RT between 2007 and 2020 were analyzed. Patients who received chemotherapy and high-dose of steroid were excluded. ANC and ALC were collected before starting RT (baseline) and within one-week before ending RT (post-treatment). Changes of ANC, ALC, and NLR between baseline and post-treatment were calculated.

Results

ALC decreased in 32 patients (78.1%). NLR increased in 31 patients (75.6%). No patients developed grade 2 or higher hematologic toxicities. The decrease of ALC was significantly correlated with the dose to brain V15 in a simple and multiple linear regression (p = 0.043). Brain V10 and V20 adjacent to V15 were also marginally significant factors determining the reduction of lymphocytes (p = 0.050 and p = 0.059, respectively). However, it was difficult to find predictive factors affecting changes of ANC and NLR.

Conclusion

In low-grade brain tumor patients who are treated by RT alone, ALC decreased and NLR increased in three-fourth of patients, although the magnitude was minimal. The decrease of ALC was mainly affected by low dose to the brain. However, RT dose was not correlated with changes of ANC or NLR.

Introduction

The proportion of circulating immune cells might play an essential role in the treatment of patients with brain tumors. Numerous studies demonstrating effects of radiation therapy (RT) on hematological variables have been conducted mostly for high-grade glioma. These patients usually received concurrent radiotherapy with chemotherapy and required high doses of steroids [1-3].
Neutrophil-to-lymphocyte ratio (NLR) is known as a significant prognosis marker of solid tumors [4]. A systemic review evaluating 100 studies of 40,559 solid tumor patients has reported that the median cutoff for NLR is 4 and that NLR above this cutoff value is associated with a worse overall survival (OS) [4]. High NLR levels are also correlated with shorter OS and progression-free survival (PFS) of patients with high-grade glioma [1-3,5].
Elevated NLR reflects either neutrophilia, lymphopenia, or both. Lymphocytes play an important role in the tumor environment and infections [6]. They are highlight sensitive to radiation. Severe treatment-related lymphopenia (<500 cells/mm3) is related to worse survival of patients with newly diagnosed solid tumors [7].
In this study, we focused on low-grade brain tumors to rule out impacts of chemotherapy and high dose of steroid use. Changes of NLR, neutrophil counts, and lymphocytes counts were evaluated. Significant factors influencing such changes were determined. We also examined effects of radiation therapy on circulating immune cells and identified significant factors in order to reduce possible RT-induced immunotoxicity.

Materials and Methods

1. Patients

Patients diagnosed with the World Health Organization (WHO) grade I or II low-grade brain tumors who received brain RT between 2007 and 2020 were included. The following eligibility criteria were used to select the study population: (1) those aged 18 years or more, (2) those who had complete blood count (CBC) data within 1 week of beginning and ending RT, and (3) those who were not exposed to chemotherapy. We excluded patients who received high dose of steroid (daily dexamethasone 5 mg or higher dose) during the treatment or patients who did not complete planned RT. A total of 41 patients were eligible and included for this study. All patients did not have any active infectious or auto-immune disease which might affect CBC. The median age of patients at diagnosis was 52 years (range, 18 to 83 years). Brain tumor pathology was mainly meningioma (n = 20; 48.8%) and low-grade gliomas (n = 12; 29.3%) (Table 1). This study was approved by the Institutional Review Board of Seoul St. Mary's Hospital (No. KC22RISI0266). The informed consent was waived.

2. Protocol of CBC and DVH analysis

Absolute neutrophil counts (ANC) and absolute lymphocyte counts (ALC) were collected before starting the RT (baseline) and within one week before finishing the RT (post-treatment). Changes of ANC, ALC, and NLR between baseline and post-treatment were calculated. The NLR was calculated by dividing ANC by ALC. Each of planning target volume (PTV) size was collected. Dosimetric factors such as maximum dose (Dmax), minimum dose (Dmin), mean dose (Dmean), and brain volume receiving ≥ 5 Gy (V5), V10, V15, V20, V25, V30, V35, V40, and V45 were extracted from brain dose-volume histogram (DVH).

3. Radiotherapy

RT was mainly used as an adjuvant treatment after operation. In the present study, 39 (96%) of 41 patients received RT for adjuvant purpose. One (2%) patient received RT for radical aim and one (2%) received it for salvage aim after recurrence. The median delivered total dose of RT was 5,400 cGy (range, 4,680 to 6,000 cGy). The fraction size of RT was mainly 180 cGy (n = 35; 85.4%) or 200 cGy (n = 5, 12.2%). Only one patient received hypo-fractionation with daily dose of 240 cGy. The duration of RT was median 42 days (range, 28 to 55 days). The three-dimensional conformal RT (3D-CRT) group consisted of 19 patients and the intensity-modulated radiotherapy (IMRT) group had 22 patients. IMRT was performed with Helical Tomotherapy (Accuray, Sunnyvale, CA, USA).
The target volume was defined as follows: gross tumor volume (GTV) was defined in patients with residual or recurrent gross disease in pre-radiotherapy brain MRI. Clinical target volume (CTV) was defined as postoperative cavity in all patients with addition of T2 high-signal intensity lesion in low-grade brain tumor patients. PTV was defined CTV plus 5-mm margin in 3D-CRT patients, and 3-mm margin in IMRT patients. IMRT was performed with daily mega-voltage CT image-guided radiotherapy (IGRT).

4. Study endpoints and statistical analysis

The primary endpoint was to define predictive factors for changes of NLR, neutrophil counts, and lymphocyte counts between before and after radiation. Secondary endpoints were changes of NLR, neutrophil counts, and lymphocyte counts between the 3D-CRT group and the IMRT group.
Factors associated with changes of ANC, ALC, or NLR were identified using simple and multiple linear regression. The forward and backward stepwise methods were used to select predictive variables in a multiple linear regression. The normality, independence, linearity, and homoscedasticity were checked for suitability of linear regression. Factors affecting severe lymphopenia were determined by logistic regression. Means of the 3D-CRT group and the IMRT group were compared using Shapiro-Wilk test, Fisher F test, and t-test. All statistical analyses were performed using R version 4.2.1 (https://cran.r-project.org/). Results were assessed as statistically significant when p-values were less than 0.05.

Results

1. Change of white blood cell counts

A total of 41 patients were evaluated. At baseline, the median neutrophil count was 3,280/µL (range, 1,720 to 7,860/µL) and the median lymphocyte count was 1,950/µL (range, 940 to 3,710/µL). Median baseline value of NLR was 1.67 (range, 0.48 to 3.63) (Table 1). The median size of PTV was 75.5 mL (range, 3.7 to 649.2 mL) and the mean dose to whole brain was 1,219 cGy (range, 480 to 3,907 cGy) (Table 2). Overall, white blood cell (WBC) count decreased only in 20 patients (48.8%). The median difference of WBC changes between before and after radiotherapy was minimal (+20/µL). Although the ANC was increased in 25 patients (61.0%) by a median of 621/µL, ALC was decreased in 32 patients (78.1%) with a median of -338/µL. Therefore, NLR was increased in 31 patients (75.6%) by a median of 41.2%. At the end of the RT, no patient developed grade 2 or higher neutropenia, neutrophilia, or lymphopenia by the Common Toxicity Criteria of Adverse Events (CTCAE) version 5.0. Only one patient developed grade 1 lymphopenia.

2. Factors affecting ALC

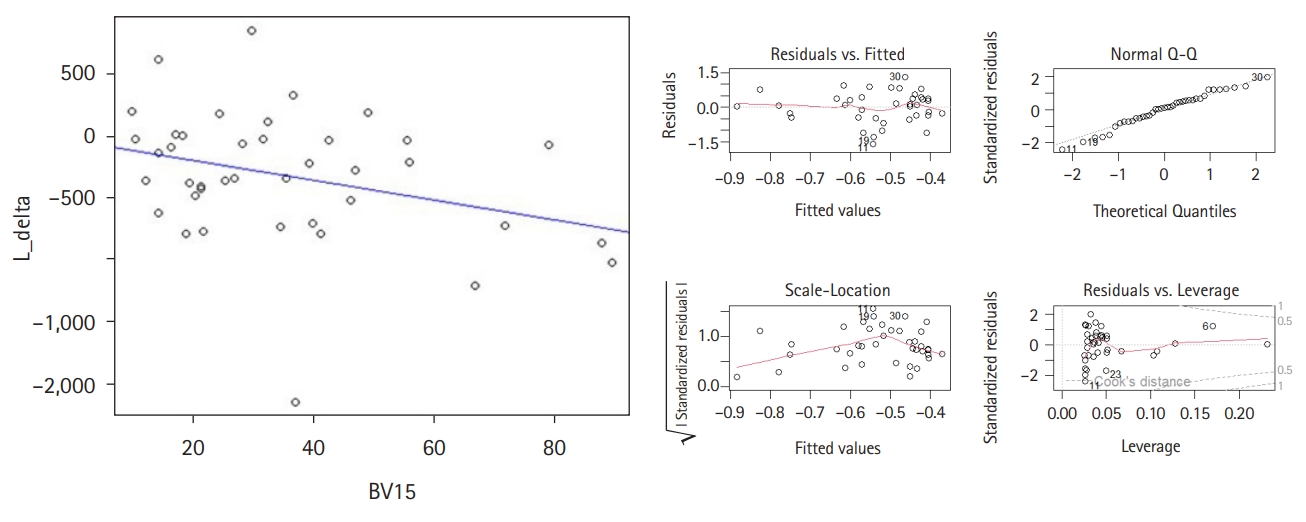
The decrease of ALC was significantly correlated with the dose to the brain V15 in a simple linear regression (p = 0.043). If we expanded 1% of brain V15, we could expect lymphocyte counts to decrease by approximately 7.95/µL (Fig. 1). Brain V10 and V20 adjacent to V15 were marginally significant factors determining the reduction of lymphocytes (p = 0.050 and p = 0.059, respectively). If PTV and the mean dose of brain were increased, there were trends toward a decrease in lymphocyte count (p = 0.078 and p = 0.073, respectively). Other clinical and dosimetric factors were not related to changes of ALC (Table 3). In a multivariate analysis, only brain V15 remained statistically significant.
Severe lymphopenia defined as a decrease of ALC by 500/μL or more was observed in 13 patients (31.7%). Mean brain V5 (25.7% vs. 21.1%, p = 0.037), V10 (59.0% vs. 38.3%, p = 0.022), and V15 (47.5% vs. 29.6%, p = 0.012) were significantly higher in these patients than in others. In logistic regression analysis, V10 was the most significant factor with a hazard ratio (HR) of 1.041 (95% confidence interval [CI], 1.007–1.076, p = 0.016) (Table 4).

3. Factors affecting absolute neutrophil count (ANC)

In both linear and logistic regression analyses, it was difficult to find predictive factors affecting the change of ANC (Tables 3, 5). The mean brain V45 was higher in patients with neutrophilia (increase of ANC) than in patients with neutropenia (13.8% vs. 7.5%) with a marginal significance (p = 0.067) in a t-test. However, it was not significant in regression analysis.

4. Factors affecting NLR

There was a correlation between lymphopenia (decrease of ALC) and increase of NLR with Pearson correlation coefficient of 0.641 (p < 0.001) (Fig. 2). However, in both linear and logistic regression analyses, there was no significant factor that could predict NLR changes (Tables 3, 5).

5. Comparison between 3D-CRT and IMRT

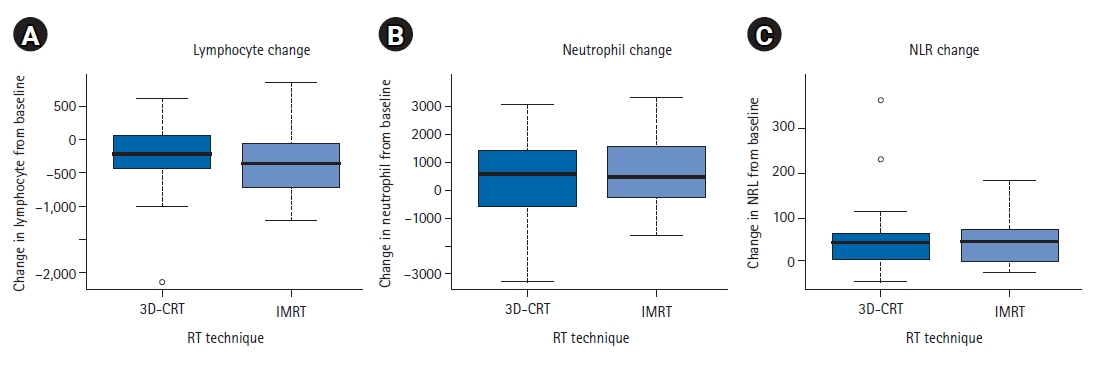
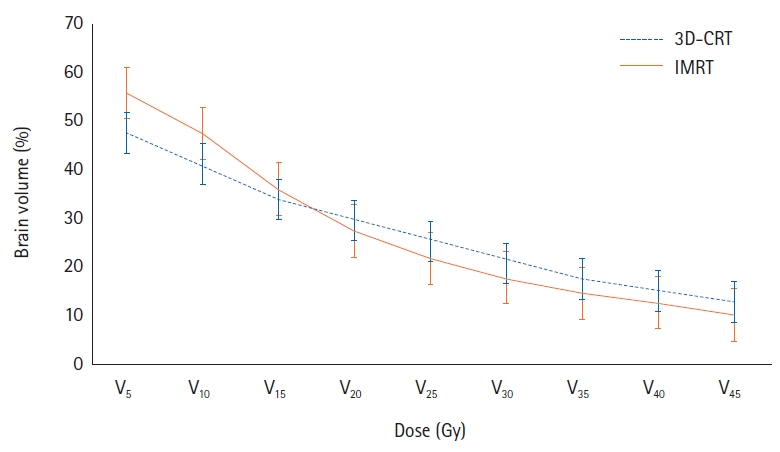
We also compared cell count differences between 3D-CRT and IMRT groups. Mean differences of ALC, ANC, and NLR were no statistically significant between 3D-CRT and IMRT groups (Fig. 3). Although the radiation dose to the brain was slightly higher for the low-dose area in the IMRT group and higher for the higher dose area in the 3D-CRT group, these differences were not statistically different (Fig. 4). The PTV volume and brain mean dose were also similar between 3D-CRT and IMRT groups.

Discussion and Conclusion

The relationship between NLR and high-grade glioma (HGG) has been evaluated in several prior studies [2,3]. Most of such studies were focused on the association of pre-treatment NLR and prognosis. Gan et al. [3] have reported that pretreatment high NLR (cutoff value 3) is an unfavorable predictor of prognosis for elderly patients with HGG. Mason et al. [2] have investigated dynamic changes of NLR during chemoradiation and demonstrated that those with a decline of NLR during treatment have better survival than those without a decline in NLR. Interestingly, although the dynamic change of NLR remained significant with OS (p = 0.0031), the pre-treatment NLR was no longer statistically relevant (p = 0.9127). Ahn et al. [8] have shown that glioblastoma patients with total lymphocyte count (TLC) <1,200 cells/mm3 at 4 weeks after completion of concurrent chemoradiotherapy show shorter survival than those with TLC ≥1,200 cells/mm3 (median OS, 14.5 vs. 21.0 months; p = 0.017). Therefore, we focused on dynamic changes of NLR before and after radiation and factors lowering NLR values, which might produce a better prognosis.
With respect to low-grade glioma, preoperative NLR has also been found to be an independent prognostic parameter of PFS and OS. Tan et al. [9] evaluated 119 patients with WHO II gliomas and concluded that preoperative high NLR with a cut-off value of 1.875 was significantly correlated with greater relapse and poor prognosis.
The correlation between survival and lymphopenia has also been shown in prior studies on solid tumors [7]. Kang et al. [10] analyzed 272 non-small cell lung cancer (NSCLC) patients treated by definite chemoradiation. Delayed lymphopenia was associated with inferior survival and lung V5 was the most important predictive dosimetric factor. Furthermore, grade ≥3 lymphopenia might be associated with a higher hazard for hospital admission with an infection [6]. Treatment-related lymphopenia could lead to an increased risk for death in cancer cohorts including malignant glioma (HR = 1.8; 95% CI, 1.13–2.87) [7]. Therefore, trying to reduce the risk of lymphopenia is reasonable.
In our study, ALC was decreased in 32 patients (78.1%) while NLR was increased in 31 patients (75.6%). Increasing low dose to the brain (such as V5, V10, and V15) might be associated with lymphopenia, which might give rise to elevated NLR. However, in brain tumor patients treated with radiation alone, the effect of radiation on lymphopenia was minimal. Only one patient experienced grade 1 lymphopenia after radiotherapy, while there was no grade 2 or higher hematologic toxicities. In addition, it was difficult to find dosimetric factors affecting the change of ANC. Therefore, it seems that the increase of NLR is not definitely correlated with radiation alone.
In addition, it has been found that tumor-associated neutrophilia is associated with poor clinical outcome in several solid cancers [11-13]. Pretreatment neutrophilia is also relevant to worse OS in malignant glioma [14]. Glucocorticoids can prolong neutrophil survival in vitro by inhibiting its apoptosis and result in neutrophilia [15,16]. Although the correlation between mean baseline dexamethasone dose and NLR was weak in a previous study [2], there is a possibility of connection between glucocorticoids and immune cells. In this sense, our analysis tried to exclude patients who had received high doses of steroids.
The volume of brain receiving radiation can be a significant dosimetric predictor of post-treatment lymphopenia. Previous studies have demonstrated that brain V25 is a sole predictive dosimetric factor for severe post-treatment lymphopenia in HGG [17]. Maintaining V25Gy of the brain below 56% might reduce the risk of acute severe lymphopenia [17]. In addition, it has been revealed that lymphocyte nadirs are significantly correlated with lower doses in lung V5–V10 (p < 0.0001) of NSCLC patients [18]. In the present study, we found that the volume of brain exposed to a low dose of radiation during RT was associated with the development of lymphopenia, with brain V10, V15, and V20 as significant dosimetric parameters. Therefore, efforts to reduce these low doses should be made to prevent lymphopenia in patients treated the brain by RT alone. Particle therapy, avoiding routine use of multiple beams or arc therapy can be an option to reduce low doses to normal brain.
However, in terms of radiotherapy technique there are also conflicting results. In one study of glioblastoma, the incidence of acute severe lymphopenia was lower in the IMRT group than in the 3D-CRT group [19]. In our study, we could not demonstrate a significant difference between 3D-CRT and IMRT groups in low-grade brain tumors. This might be due to small differences of brain doses between 3D-CRT and IMRT groups. It might also be due to the fact that the majority of patients (12 out of 19) in the 3D-CRT group were treated with non-coplanar beams. These beam alignments might have reduced the difference in low brain dose between 3D-CRT and IMRT groups.
This study has several limitations. First, this was a retrospective study performed in a single institution with a small sample size. Several patients who received a high dose of steroid due to brain edema were excluded from analysis, leading to a small sample size. Another limitation was that the timing of blood sampling was different. In addition, it was difficult to determine the persistence of lymphopenia because post-treatment follow-up laboratory data was missing in more than half of the patients.
In conclusion, a decrease of ALC and an increase of NLR were observed in three-fourth of patients in low-grade brain tumor patients treated by RT alone. The decrease of ALC was mainly affected by low dose to the brain such as V10, V15, and V20. However, we could not find a correlation between RT dose and changes of ANC or NLR. Further evaluations with a larger group of patients and a regular timing of blood collection are needed to draw a definite conclusion.

Notes

Statement of Ethics

This study was approved by the Institutional Review Board of Seoul St. Mary's Hospital (No. KC22RISI0266).

Conflict of Interest

No potential conflict of interest relevant to this article was reported.

Funding

None.

Author Contributions

Conceptualization, Song JH. Investigation and methodology, Choi YK, Jang HS. Supervision, Song JH, Choi BO. Writing of the original draft, Choi YK, Lee SW. Writing of the review and editing, Choi YK, Song JH. Formal analysis, Choi YK, Lee SW. Data curation, Jang HS, Choi BO. Visualization, Choi YK, Song JH.

Data Availability Statement

The data that support the findings of this study are available from the corresponding author upon reasonable request.

Fig. 1.
(Left) Liner regreesion of abosulte lymphocyte count (ALC) change with brain V15. If we expanded 1% of brain V15, we could expect lymphocyte counts to decrease by approximately 7.95/µL. (Right) The normality, independence, linearity, and homoscedasticity were checked for suitability of linear regression.
roj-2022-00668f1.jpg
Fig. 2.
Correlation the change between absolute lymphopenia count (ALC) and neutrophil-to-lymphocyte ratio (NLR).
roj-2022-00668f2.jpg
Fig. 3.
Mean differences of (A) lymphocyte, (B) neutrophil and (C) NLR change between RT techniques (3D-CRT vs. IMRT). NLR, neutrophil-to-lymphocyte ratio; 3D-CRT, three-dimensional conformal radiotherapy; IMRT, intensity-modulated radiotherapy; RT, radiation therapy.
roj-2022-00668f3.jpg
Fig. 4.
Comparison of dose-volume histogram between radiation techniques RT techniques (3D-CRT vs. IMRT). 3D-CRT, three-dimensional conformal radiotherapy; IMRT, intensity-modulated radiotherapy; RT, radiation therapy.
roj-2022-00668f4.jpg
Table 1.
Clinical characteristics of patients (n = 41)
Characteristic Value
Age (yr) 52 (18–83)
Sex
 Female 21 (51.2)
 Male 20 (48.8)
Diagnosis
 Meningioma 20 (48.8)
 Low-grade glioma 12 (29.3)
 Others 9 (21.9)
Tumor location
 Frontal 11 (26.8)
 Temporal 9 (21.9)
 Occipital 1 (2.4)
 Parietal 4 (9.7)
 Deep brain location 8 (19.5)
 Cerebellum 9 (19.7)
Extent of resection
 Total resection 21 (51.2)
 Subtotal resection 8 (19.6)
 Partial resection 6 (14.6)
 Biopsy 6 (14.6)
RT technique
 3D-CRT 19 (46.3)
 IMRT 22 (53.7)
Baseline WBC counts (/µL) 6,200 (3,850–11,520)
Baseline ANC (/µL) 3,280 (1,720–7,860)
Baseline ALC (/µL) 1,950 (940–3,710)
Baseline NLR 1.67 (0.48–3.63)

Values are presented as median (range) or number (%).

RT, radiation therapy; 3D-CRT, three-dimensional conformal radiotherapy; IMRT, intensity-modulated radiotherapy; WBC, white blood cell; ANC, absolute neutrophil counts; ALC, absolute lymphocyte counts; NLR, neutrophil-to-lymphocyte ratio.

Table 2.
Clinical treatment characteristics of patients (n = 41)
Characteristic Value
Delivered total dose (cGy) 4,140 (2,000–5,580)
Fraction size (cGy) 180 (180–240)
RT duration (day) 42 (28–55)
PTV size (mL) 75.5 (3.7–649.2)
Brain Dmax (cGy) 5,302 (4,685–6,443)
Brain Dmin (cGy) 37 (0–146)
Brain Dmean (cGy) 1,219.5 (480–3,907)
Brain V5 (%) 48.2 (15.1–97.4)
Brain V10 (%) 41.3 (11.7–94.1)
Brain V15 (%) 30.6 (9.7–89.6)
Brain V20 (%) 24.15 (8.5–82.9)
Brain V25 (%) 19.5 (5.9–77.7)
Brain V30 (%) 17.05 (4.3–601)
Brain V35 (%) 12.9 (3.2–67.4)
Brain V40 (%) 10.5 (2.4–62.5)
Brain V45 (%) 8.6 (1.7–56.6)

Values are presented as median (range).

RT, radiation theapy; PTV, planning target volume.

Table 3.
Linear regression analysis for changes of ANC, ALC, and NLR
ANC
ALC
NLR
Coefficient (B) p-value Coefficient (B) p-value Coefficient (B) p-value
Age 6.703 0.639 -121.55 0.499 0.626 0.432
PTV (mL) 0.306 0.865 -1.18 0.078 0.078 0.443
Brain mean dose (cGy) -0.073 0.793 -0.18 0.073 0.006 0.717
Brain V5 (%) -7.820 0.403 -5.06 0.152 -0.175 0.741
Brain V10 (%) -5.472 0.570 -6.93 0.050a) 0.079 0.885
Brain V15 (%) -3.943 0.711 -7.95 0.043b) 0.282 0.639
Brain V20 (%) -3.752 0.753 -8.31 0.059 0.340 0.613
Brain V25 (%) -2.591 0.845 -8.47 0.085 0.417 0.576
Brain V30 (%) 2.608 0.857 -7.59 0.160 0.406 0.618
Brain V35 (%) 5.041 0.754 -7.68 0.201 0.489 0.589
Brain V40 (%) 5.507 0.751 -8.69 0.181 0.565 0.563
Brain V45 (%) 8.018 0.673 -9.42 0.185 0.682 0.524
RT duration -24.730 0.575 -19.34 0.238 -0.531 0.830

ANC, absolute neutrophil counts; ALC, absolute lymphocyte counts; NLR, neutrophil-to-lymphocyte ratio; PTV, planning target volume; RT, radiation therapy.

a) Statistically significant in simple linear regression and

b) statistically significant in simple and multiple linear regression.

Table 4.
Logistic regression analysis for severe ALC decline (more than 500/μL)
Coefficient (B) Exp(B) (95% CI) p-value
Age (<60 vs. >60 yr) -0.629 0.533 (0.131–2.178) 0.381
Sex (male vs. female) -0.613 0.542 (0.142–2.072) 0.370
RT technique (3D-CRT vs. IMRT) 0.954 2.596 (0.654–10.448) 0.179
PTV (mL) 0.005 1.005 (0.999–1.011) 0.128
Brain mean dose (cGy) 0.001 1.001 (1.000–1.002) 0.033a)
Brain V5 (%) 0.036 1.036 (1.004–1.070) 0.027a)
Brain V10 (%) 0.040 1.041 (1.007–1.076) 0.016b)
Brain V15 (%) 0.042 1.043 (1.006–1.081) 0.024a)
Brain V20 (%) 0.040 1.041 (1.001–1.082) 0.046a)
Brain V25 (%) 0.040 1.041 (0.998–1.086) 0.064
Brain V30 (%) 0.039 1.040 (0.994–1.088) 0.091
Brain V35 (%) 0.039 1.040 (0.990–1.093) 0.121
Brain V40 (%) 0.044 1.045 (0.990–1.103) 0.113
Brain V45 (%) 0.049 1.050 (0.989–1.115) 0.112
RT duration 0.073 1.076 (0.001–1.239) 0.311

ALC, absolute lymphocyte counts; RT, radiation therapy; 3D-CRT, three-dimensional conformal radiotherapy; IMRT, intensity-modulated radiotherapy; PTV, planning target volume; CI, confidence interval.

a) Statistically significant in simple linear regression and

b) statistically significant in simple and multiple linear regression.

Table 5.
Logistic regression for neutrophilia, lymphopenia, and increasement of NLR
Neutrophilia (ANC increase)
Lymphopenia (ALC decrease)
NLR increase
Coefficient EXP(B) (95% CI) p-value Coefficient EXP(B) (95% CI) p-value Coefficient EXP(B) (95% CI) p-value
Age (<60 vs. >60 yr) 0.891 2.437 (0.545–10.898) 0.244 0.875 2.400 (0.515–11.185) 0.265 -0.651 0.522 (0.117–2.337) 0.395
Sex (male vs. female) -0.752 0.471 (0.131–1.702) 0.251 0.223 1.250 (0.283–5.525) 0.769 0.470 1.600 (0.376–6.808) 0.525
RT technique (3D-CRT vs. IMRT) 0.241 1.273 (0.362–4.480) 0.707 1.073 2.923 (0.617–13.843) 0.176 -0.341 0.711 (0.167–3.026) 0.644
PTV (mL) 0.007 1.007 (0.998–1.015) 0.132 0.009 1.009 (0.996–1.023 0.182 0.004 1.004 (0.995–1.013) 0.361
Brain mean dose (cGy) 0.001 1.001 (1.000–1.001) 0.261 0.001 1.001 (1.000–1.002) 0.207 0.000 1.000 (0.999–1.001) 1.000
Brain V5 (%) 0.002 1.002 (0.976–1.029) 0.881 0.029 1.030 (0.991–1.070) 0.130 -0.007 0.993 (0.964–1.023) 0.649
Brain V10 (%) 0.008 1.008 (0.980–1.037) 0.573 0.041 1.042 (0.995–1.092) 0.083 0.004 1.004 (0.973–1.037) 0.797
Brain V15 (%) 0.017 1.017 (0.984–1.051) 0.318 0.039 1.040 (0.987–1.095) 0.144 0.009 1.009 (0.973–1.047) 0.629
Brain V20 (%) 0.023 1.024 (0.984–1.064) 0.242 0.034 1.035 (0.979–1.094) 0.224 0.012 1.012 (0.971–1.056) 0.566
Brain V25 (%) 0.029 1.029 (0.984–1.076) 0.211 0.030 1.031 (0.973–1.092) 0.304 0.011 1.011 (0.965–1.058) 0.649
Brain V30 (%) 0.040 1.041 (0.986–1.099) 0.147 0.022 1.022 (0.964–1.083) 0.467 0.019 1.019 (0.965–1.076) 0.496
Brain V35 (%) 0.049 1.050 (0.986–1.119) 0.131 0.021 1.021 (0.958–1.088) 0.525 0.020 1.020 (0.960–1.083) 0.523
Brain V40 (%) 0.050 1.051 (0.982–1.125) 0.148 0.025 1.025 (0.955–1.100) 0.492 0.019 1.019 (0.956–1.086) 0.568
Brain V45 (%) 0.063 1.065 (0.981–1.156) 0.130 0.017 1.017 (0.946–1.094) 0.642 0.025 1.026 (0.952–1.105) 0.504
RT duration (days) -0.043 0.958 (0.841–1.091) 0.516 -0.184 0.832 (0.693–0.999) 0.049* -0.013 0.987 (0.855–1.141) 0.864

NLR, neutrophil-to-lymphocyte ratio; ANC, absolute neutrophil counts; ALC, absolute lymphocyte counts; RT, radiation therapy; 3D-CRT, three-dimensional conformal radiotherapy; IMRT, intensity-modulated radiotherapy; PTV, planning target volume.

*p < 0.05.

References

1. Bambury RM, Teo MY, Power DG, et al. The association of pre-treatment neutrophil to lymphocyte ratio with overall survival in patients with glioblastoma multiforme. J Neurooncol 2013;114:149–54.
crossref pmid pdf
2. Mason M, Maurice C, McNamara MG, et al. Neutrophil-lymphocyte ratio dynamics during concurrent chemo-radiotherapy for glioblastoma is an independent predictor for overall survival. J Neurooncol 2017;132:463–71.
crossref pmid pdf
3. Gan Y, Zhou X, Niu X, et al. Neutrophil/lymphocyte ratio is an independent prognostic factor in elderly patients with high-grade gliomas. World Neurosurg 2019;127:e261–7.
crossref pmid
4. Templeton AJ, McNamara MG, Seruga B, et al. Prognostic role of neutrophil-to-lymphocyte ratio in solid tumors: a systematic review and meta-analysis. J Natl Cancer Inst 2014;106:dju124.
crossref pmid
5. Lopes M, Carvalho B, Vaz R, Linhares P. Influence of neutrophil-lymphocyte ratio in prognosis of glioblastoma multiforme. J Neurooncol 2018;136:173–80.
crossref pmid pdf
6. Terrones-Campos C, Ledergerber B, Vogelius IR, Specht L, Helleberg M, Lundgren J. Lymphocyte count kinetics, factors associated with the end-of-radiation-therapy lymphocyte count, and risk of infection in patients with solid malignant tumors treated with curative-intent radiation therapy. Int J Radiat Oncol Biol Phys 2019;105:812–23.
crossref pmid
7. Grossman SA, Ellsworth S, Campian J, et al. Survival in patients with severe lymphopenia following treatment with radiation and chemotherapy for newly diagnosed solid tumors. J Natl Compr Canc Netw 2015;13:1225–31.
crossref pmid pmc
8. Ahn S, Park JS, Jang J, et al. The association between total lymphocyte count after concomitant chemoradiation and overall survival in patients with newly diagnosed glioblastoma. J Clin Neurosci 2020;71:21–5.
crossref pmid
9. Tan Z, Shen L, Wu H, Deng L, Li Z, Huang X. Preoperative neutrophil/lymphocyte ratio is an independent prognostic biomarker in patients with low-grade gliomas. World Neurosurg 2019;132:e585–90.
crossref pmid
10. Kang BH, Li X, Son J, et al. Prediction and clinical impact of delayed lymphopenia after chemoradiotherapy in locally advanced non-small cell lung cancer. Front Oncol 2022;12:891221.
crossref pmid pmc
11. Escande A, Haie-Meder C, Maroun P, et al. Neutrophilia in locally advanced cervical cancer: a novel biomarker for image-guided adaptive brachytherapy? Oncotarget 2016;7:74886–94.
crossref pmid pmc
12. Schernberg A, Escande A, Rivin Del Campo E, et al. Leukocytosis and neutrophilia predicts outcome in anal cancer. Radiother Oncol 2017;122:137–45.
crossref pmid
13. Shen M, Hu P, Donskov F, Wang G, Liu Q, Du J. Tumor-associated neutrophils as a new prognostic factor in cancer: a systematic review and meta-analysis. PLoS One 2014;9:e98259.
crossref pmid pmc
14. Schernberg A, Nivet A, Dhermain F, et al. Neutrophilia as a biomarker for overall survival in newly diagnosed high-grade glioma patients undergoing chemoradiation. Clin Transl Radiat Oncol 2018;10:47–52.
crossref pmid pmc
15. Liles WC, Dale DC, Klebanoff SJ. Glucocorticoids inhibit apoptosis of human neutrophils. Blood 1995;86:3181–8.
crossref pmid pdf
16. Ruiz LM, Bedoya G, Salazar J, Garcia de O D, Patino PJ. Dexamethasone inhibits apoptosis of human neutrophils induced by reactive oxygen species. Inflammation 2002;26:215–22.
crossref pmid
17. Huang J, DeWees TA, Badiyan SN, et al. Clinical and dosimetric predictors of acute severe lymphopenia during radiation therapy and concurrent temozolomide for high-grade glioma. Int J Radiat Oncol Biol Phys 2015;92:1000–7.
crossref pmid
18. Tang C, Liao Z, Gomez D, et al. Lymphopenia association with gross tumor volume and lung V5 and its effects on non-small cell lung cancer patient outcomes. Int J Radiat Oncol Biol Phys 2014;89:1084–91.
crossref pmid
19. Byun HK, Kim N, Yoon HI, et al. Clinical predictors of radiation-induced lymphopenia in patients receiving chemoradiation for glioblastoma: clinical usefulness of intensity-modulated radiotherapy in the immuno-oncology era. Radiat Oncol 2019;14:51.
crossref pmid pmc pdf
TOOLS
PDF Links  PDF Links
PubReader  PubReader
ePub Link  ePub Link
XML Download  XML Download
Full text via DOI  Full text via DOI
Download Citation  Download Citation
  Print
Share:      
METRICS
0
Crossref
0
Scopus
1,343
View
44
Download
Related article
Editorial Office
Department of Radiation Oncology, Samsung Medical Center,
Proton Therapy Center, B2, 81, Irwon-ro, Gangnam-gu, Seoul 06351, Republic of Korea
Tel : +82-2-3410-3617
E-mail: rojeditor@gmail.com, roj@kosro.or.kr
Copyright © The Korean Society for Radiation Oncology.                      Developed in M2PI
Close layer
prev next