


Introduction
Peroxisome proliferator-activated receptor ╬│ (PPAR╬│) is a critical transcription factor in the regulation of glucose and lipid metabolism [1]. Some of PPAR╬│ agonists (rosiglitazone, pioglitazone) are currently used for the control of type II diabetes [2]. In addition, PPAR╬│ agonist is of particular interest as a potential anticancer agent because of its effect on cellular differentiation, proliferation, and tumorigenesis [3,4]. Troglitazone (TRO) is a synthetic PPAR╬│ agonist and has been studied extensively on its antiproliferative activities against many human cancer cells in vitro and in vivo, including those of prostate [5], breast [6], thyroid [7,8], lung [9,10], pituitary [11], colon [12] and liver [13]. This growth inhibition by TRO is linked to the G1 phase cell cycle arrest through the up-regulation of the cyclin-dependent kinase inhibitors p21 and p27 [14-16] and/or repression of cyclin D1 expression [17,18]. The cells in G1 phase are relatively more radiosensitive than those in S phase, and this may cause radiosensitization. On the other hand, TRO shares a common structure with vitamin E which has a potent antioxidant property [19]. In addition, TRO can cause an induction of Cu2+/Zn2+-superoxide dismutase (CuZnSOD) [20,21] and the activated receptor complexes of TRO can induce catalase through binding to its promoter region [22,23]. Both SOD and catalase may decrease radiation sensitivity via reactive oxygen species (ROS) scavenging. Although TRO was withdrawn from the market due to idiosyncratic hepatotoxicity [24], there is still much interest about the antitumor effect of TRO [25-27]. Most of antitumor effects was observed at relatively high concentrations (20-50 ┬ĄM) of TRO, while the clinically achievable concentrations are around 2-5 ┬ĄM [28,29]. In addition, although combining low-dose PPAR╬│ agonists with other drugs [27,30] is highly effective, combining with radiation therapy has not been reported yet.
From the above we were interested in what will be the net result of combining low dose TRO and radiation by the contradictory effect of TRO; SOD or catalase induction and increased G1 cells. PPAR╬│ agonist mediated growth inhibition is PPAR╬│-dependent or -independent [31,32]. Therefore, we investigated the combining effects of TRO and radiation in cervix cancer cell lines with different level of PPAR╬│ expression.
Materials and Methods
1. Cells and culture conditions
The cell lines were purchased from the Korean Cell Line Bank (Seoul, Korea). Cells were grown in Dulbecco's modified Eagle's medium (DMEM) or Roswell Park Memorial Institute (RPMI) containing 10% fetal bovine serum (FBS) supplemented with 100 IU/mL penicillin, 100 ┬Ąg/mL streptomycin. The cells were kept in a humidified atmosphere containing 5% CO2 at 37Ōäā, and passaged by trypsinization. TRO was purchased from Cayman Chemical (Ann Arbor, MI, USA) and dissolved in dimethyl sulfoxide (DMSO) at a final concentration of 0.1% DMSO in the culture medium. All standard culture reagents were from Invitrogen (Carlsbad, CA, USA).
2. Protein extraction for western blot and catalase activity assay
Cell proteins was obtained by rinsing the cells with phosphate-buffered saline (PBS) pH 7.2 three times, scraping the cells from the culture flasks with a rubber policeman. The cells were washed with PBS by centrifugation two times. Pellets were kept frozen at -80Ōäā until use. At the time of analysis, the cell pellets were resuspended in one volume of 50 mM potassium phosphate buffer (pH 7.85) and sonicated on ice 3 times for 10 seconds using a sonicator (Branson 1510R-DTH, Danbury, CT, USA). Protein concentration was determined using the Bradford method using bovine serum albumin as a standard [33].
3. Western blot analysis
Proteins was denatured in 1 volume of sample buffer containing 62.5 mM Tris-HCl (pH 6.8), 10% glycerol, 2% sodium dodecyl sulfate (SDS), 5% ╬▓-mercaptoethanol (v/v) and 2-3 drops of saturated bromophenol blue solution at 100Ōäā for 3 minites. The proteins were separated in a 12.5% denaturing polyacrylamide gel by electrophoresis and then transferred onto nitrocellulose membranes at 100 V for 1 hour on ice. The blots were then blocked in 4% dry milk in Tween-Tris buffered saline (TTBS, 0.02 M Tris buffer [pH 7.0] and 0.5% Tween 20) at room temperature for 2 hours and incubated with primary antibody (1:1,000) in TTBS at 4Ōäā overnight. After washing three times with TTBS, 5 minutes each, the blots were incubated with secondary antibody (1:10,000). After washing three times, the blots were visualized using chemiluminescence (Intron Biotechnology, Seongnam, Korea). The antibodies for CuZnSOD, MnSOD, and catalase were purchased from AbFrontier (Seoul, Korea).
4. Catalase activity assay
Cells were treated with 2-10 ┬ĄM of TRO for 24 hours. After getting cell pellets as described previously, protein concentration was determined using Bradford assay. Catalase activity was quantitated spectrophotometrically following the decomposition of H2O2 at 240 nm [34]. The catalase activity was expressed as U/mg protein.
5. RNA isolation and quantitative real-time polymerase chain reaction
RNA was isolated from the cells using TRIzol reagent according to the manufacturer's protocol (Invitrogen, Carlsbad, CA, USA). cDNA synthesized using iScript reverse transcriptase reagent (Bio-Rad, Hercules, CA, USA) from 1 ┬Ąg of RNA. For real-time quantitative reverse transcription polymerase chain reaction (RT-PCR) for catalase, the following primers were used: forward 5'-GCCATTGCCACAGGAAAG-3', reverse 5'-GTCCTTGTGAGGCCAAACC-3'. The RT-PCR was performed in total 20 ┬ĄL of reaction solution containing diluted cDNA, 20 pmol of each primer, 10 ┬ĄL of two-step SYBR green PCR (Finnzymes, Espoo, Finland) master mix and water. The thermal cycling parameters were 95Ōäā for 10 minutes for Taq polymerase activation followed by 40 cycles of 95Ōäā for 15 seconds, 60Ōäā for 1 minute. The reactions were performed in triplicates in each experiment. The threshold cycles (Ct) were recorded from all the samples for both the target gene and the reference gene (glyceraldehyde 3-phosphate dehydrogenase, GAPDH). Melting curve analysis was done for each run. Relative gene expression of the target gene was calculated as ╬ö╬öCt, determined by subtracting the ╬öCt of reference gene from the ╬öCt of target gene. Experiment was repeated three times independently. The PCR machine and software used for this experiment is Rotor-Gene 6000 (Corbett Research Pty Ltd., Mortlake, NSW, Australia) and Rotor-Gene 6000 series software 1.7.
6. ROS measurement
Intracellular production of ROS was measured using the fluorescent dye, 2',7'-dichlorodihydrofluorescein-diacetate (H2DCFDA) (Sigma, St. Louis, MO, USA) as described by Wan et al. [35]. Two days prior to experiments, cells were plated on 60 mm dishes. Cells were then exposed to 5 ┬ĄM of TRO for 24 hours. After drug treatment the cells were rinsed with PBS (no phenol red, Ca2+, or Mg2+) and incubated with 10 ┬ĄM of H2DCFDA at 37Ōäā for 10 minutes, and then irradiated using a linear accelerator (Mevatron, Siemens, CA, USA) at room temperature. The cells were detached with 0.25% trypsin and 0.11% EDTA, washed and resuspended in cold PBS and placed on ice, and analyzed using a FACScan flow cytometer (FACS Calibur-S; Becton Dickinson, San Jose, CA, USA) (488 nm excitation, 530 nm emission). The mean geometric fluorescence intensity for 30,000 cells was analyzed for each sample using CellQuest Pro software (BD Biosciences, San Jose, CA, USA).
7. Cell cycle analysis
Cells were seeded in 60 mm culture plates. Next day, the cells were treated with 0-10 ┬ĄM of TRO for 24 hours. Next, the cells were harvested by trypsinization and washed two times with PBS, then fixed overnight with 70% ethanol at -20Ōäā. The cells were washed two times with PBS, resuspended with 1 mL of propidium iodide staining solution and then incubated for 30 minutes at 37Ōäā. Analysis of cell cycle distribution was performed using a flow cytometer (FACS Calibur-S; Becton Dickinson).
8. Clonogenic assay
Cells in growing phase were treated with TRO for 24 hours and irradiated. Irradiation was done using a linear accelerator (Mevatron, Siemens, CA, USA) with a dose rate of 3 Gy/minutes at room temperature. Varying number (100-1,600) of cells for optimal colony counting was seeded in 60 mm dishes according to the presence or absence of TRO and radiation. After 6-7 days the cells were stained with 0.1% crystal violet solution and colonies which are composed of at least 50 cells, were counted.
Results
1. PPAR╬│ expression in cervix cancer cell lines
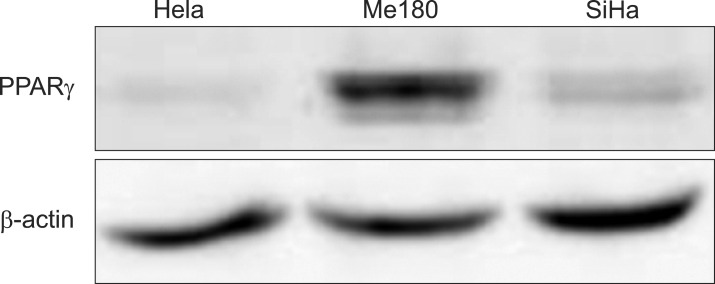
First, to know the expression pattern of PPAR╬│ in cervix cancer cells the expression was screened with Western blot in three cervix cancer cell lines. PPAR╬│ expression was high in Me180, and low in HeLa and SiHa (Fig. 1).
2. SOD and catalase protein expression by TRO
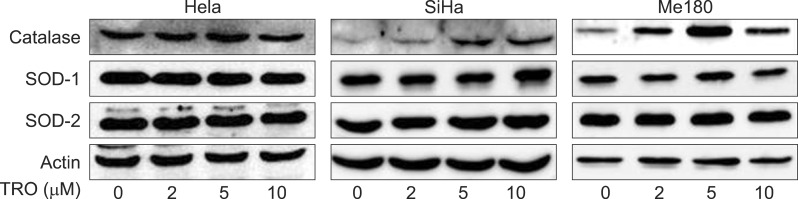
Both of CuZnSOD and MnSOD were not changed significantly by TRO (2, 5, and 10 ┬ĄM for 24 hours) in all three cell lines. On the contrary, catalase increased according to the dose of TRO and reached maximum at 5 ┬ĄM (Fig. 2) in HeLa and Me180 cells. Increased catalase protein expression by TRO was much higher in Me180 (high PPAR╬│ expression) than HeLa cells.
3. Catalase activity by TRO
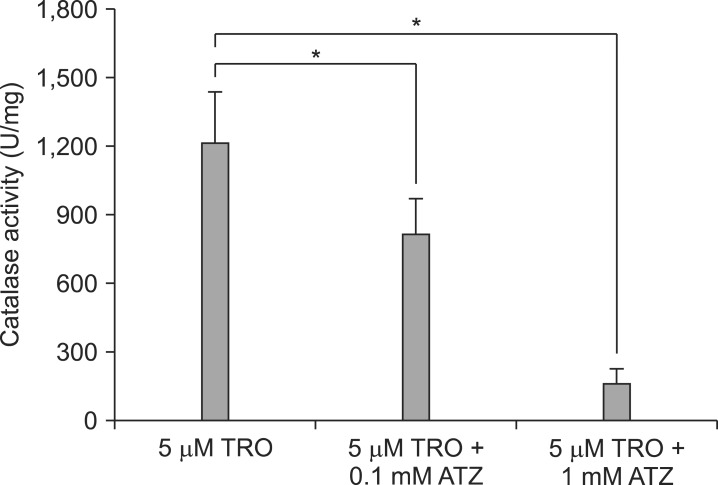
To confirm the correlation between the protein expression of catalase and its biological activity, catalase activity was measured. The activity was maximal at 5 ┬ĄM of TRO with 1.32 and 1.26 times higher than control in HeLa and Me180 cells, respectively (Fig. 3). The low catalase activity with 10 ┬ĄM of TRO seems to be due to cytotoxic effect of TRO in higher doses, because many cells were dead with 10 ┬ĄM of TRO. On the contrary, catalase activity continued to increase up to 10 ┬ĄM of TRO in SiHa cells; 4.02 times higher than control. SiHa cells seem to be more resistant to high does TRO than the other cell lines. We confirmed catalase activity was suppressed by 3-amino-1, 2, 4-triazole (ATZ), a chemical catalase inhibitor, dose dependently (0.1, 1 mM) (Fig. 4).
4. Catalase mRNA expression by TRO
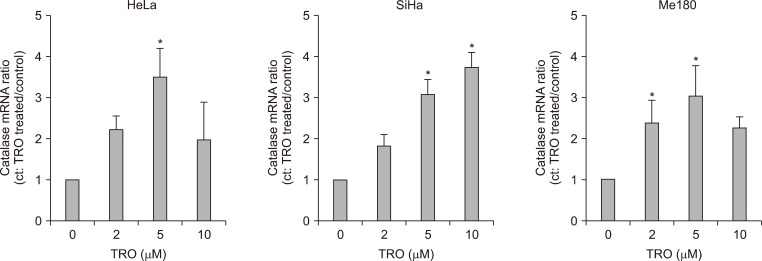
To know whether increased catalase protein and activity come from induction of its mRNA, we measured mRNA expression using real time RT-PCR. As with the protein expression and activity, mRNA expression was maximal at 5 ┬ĄM of TRO in HeLa and Me180 cells (Fig. 5). In the other hand, catalase mRNA was increased even at 10 ┬ĄM in SiHa cells as with that of activity (Fig. 5).
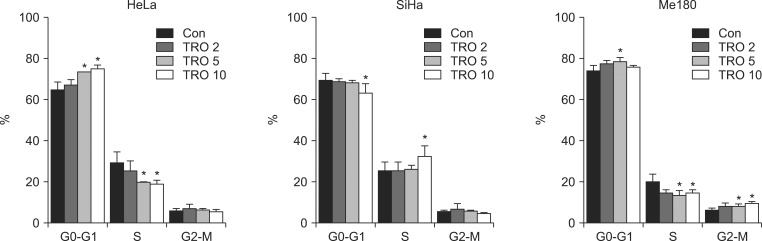
5. Cell cycle phase distribution change by TRO
Cell cycle distribution is one of the important factors which govern radiation sensitivity. To know the cell cycle effect of TRO the cells were treated with TRO and cell cycle phase distribution was analyzed. In HeLa and Me180 the cells in G0-G1 phase increased and those in S phase decreased with TRO treatment (Fig. 6). After 24 hours treated with 5 ┬ĄM TRO, the cells in G0-G1 phase increased from 64.5% to 73.5% and those in S phase decreased from 29.3% to 20.0% in HeLa cells. Such a cell cycle change pattern was observed in Me180 too: the cells in G0-G1 phase increased from 73.9% to 78.6% and those in S phase decreased from 20.1% to 13.2%. However, such a cell cycle change was not observed in SiHa cells, that is, G0-G1 cells was decreased and S-phase cells were increased especially at 10 ┬ĄM TRO (Fig. 6).
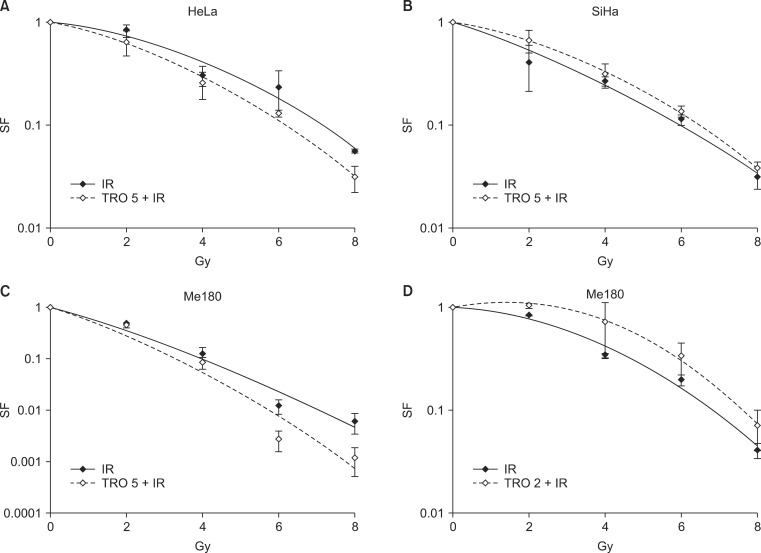
6. Survival change by radiation with or without TRO
To know the final outcome of radioprotective effect by catalase induction and radiosensitizing effect by cell cycle phase distribution clonogenic assay was done. The cells were treated with 5 ┬ĄM of TRO for 24 hours, which induces catalase and cells in G0-G1 phase maximally in HeLa and Me180 cells, and irradiated. Pretreatment with TRO increased radiation sensitivity in HeLa and Me180 cells (Fig. 7). However, it decreased radiation sensitivity in SiHa cells. These results indicate that cell cycle change by 5 ┬ĄM of TRO is more influential on radiation sensitivity than catalase induction in HeLa and Me180 cells. To differentiate the effect of cycle change from increased catalase activity, Me180 cells were treated with 2 ┬ĄM of TRO for 24 hours, which increased catalase activity but not G0-G1 cells, irradiated and clonogenic cell survival was measured. With 2 ┬ĄM of TRO radioprotective effect was observed (Fig. 7).
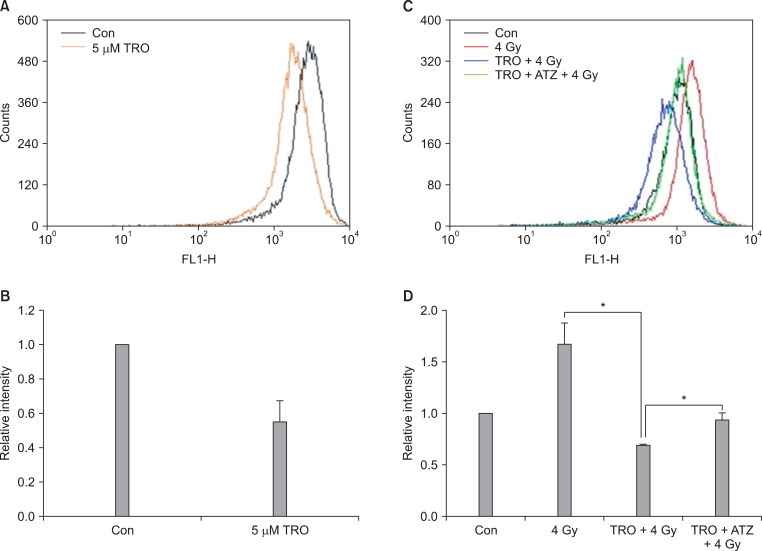
7. ROS change by radiation with or without TRO
To confirm TRO-induced catalase contributes to scavenge radiation-produced ROS and gives rise to radioprotective effect, HeLa cells were treated with 4 Gy with or without 5 ┬ĄM of TRO and the change of ROS was measured. ROS was decreased with TRO. ROS was increased by irradiation and it was decreased in the cells pretreated with TRO (Fig. 8). With the addition of ATZ ROS was increased compared with TRO alone (Fig. 8). As shown in Fig. 4 catalase was decreased with the addition of ATZ. This indicates that catalase induced by TRO contributes to scavenge of ROS produced by radiation.
Discussion and Conclusion
In this study we showed TRO increases radiation sensitivity through G0-G1 arrest or decreases radiation sensitivity through catalase-mediated ROS scavenging effect according to TRO dose or cell types in cervix cancer cell lines.
The PPAR responsive element (PPRE) was identified in the rat catalase promoter region and PPAR╬│ agonists (rosiglitazone, ciglitazone) increase catalase mRNA and activity [22]. Conceptually, it is highly probable that TRO, as a member of PPAR╬│ agonist, also induces catalase by binding to PPRE in the catalase promoter. However, there was no report on catalase induction by TRO yet and this is the first paper verifying catalase induction by TRO. TRO increased catalase mRNA, protein and activity in all three cervix cancer cell lines tested in this study regardless of basal level of PPAR╬│ expression. A chemical inhibitor of catalase, ATZ, reduced catalase activity and decreased ROS scavenging effect of TRO. It can be postulated that the increased catalase plays a major role in the ROS scavenging effect of TRO. TRO has been expected to have an antioxidant activity from the viewpoint of its chemical structure. TRO has a chromane moiety similar to ╬▒-tocopherol, whose antioxidant activity relies on the effective donation of hydrogen from the hydroxyl group of the chromane ring to reactive radicals [19,36]. The antioxidant activity of TRO has been demonstrated in many studies. TRO inhibits lipid peroxidation of low-density lipoprotein (LDL) [37,38], and inhibits ROS generation in both of polymorphonuclear leukocytes (PMNLs) and mononuclear cells (MNCs), results in inhibition of lipid peroxidation in the obese [39]. However, most previous studies have focused on the structure-based antioxidant activity of TRO. Our study revealed that antioxidant activity of TRO come from not only chemical structure but also catalase induction. The antioxidant activity of TRO is dose dependent. That is, in higher dose (usually over 20 ┬ĄM) TRO has a prooxidant activity and causes antiproliferation and cell death [19,40]. Twenty ┬ĄM is much higher than that of clinically achievable concentration. If a patient takes 400 mg/day and 600 mg/day the maximum plasma concentration of TRO was reported as 3.6 ┬ĄM and 6.3 ┬ĄM, respectively [41]. With such a low concentration, cytocidal effect of TRO is negligible and combination with other agents has shown synergistic effect [27,30]. Radiation therapy is one of the most important modalities for cancer treatment. TRO induces G0-G1 arrest and catalase and those two are important factors which may determine radiation sensitivity. About two thirds of the biologic effect by X-rays is caused by indirect action, which is mediated by free radicals produced from water. Catalase converts H2O2 to water and O2. In this study, catalase-mediated radioprotective effect was overcome by cell cycle-mediated (G0-G1 arrest) radiosensitizing effect by 5 ┬ĄM of TRO for 24 hours in HeLa and Me180 cells. With 2 ┬ĄM of TRO, which increased catalase but not G0-G1 cells, radiation sensitivity was decreased. In Me190 cells, catalase activity was increased significantly with 2 ┬ĄM of TRO compared with other cell lines.
SOD is one of the important enzymes which remove free radicals. TRO has been reported to induce CuZnSOD [20,21]. However, SOD proteins were not increased in all three cell lines tested in this study. This suggests that the induction of antioxidant enzymes, such as SOD and catalase by TRO is dependent on cell lines and cell types.
TRO is attractive as a possible anticancer drug. However, its antiproliferative effect has been studied usually with high doses (over 20 ┬ĄM). Due to its heptotoxicity low dose of TRO combined with other modalities can be suggested. However, its catalase induction and cell cycle change can affect on the effect of other modalities. Therefore, on using TRO combined with other modalities, the factors which might affect on the effect of others have to be considered.