Effect of leukocyte alteration on treatment outcomes following preoperative chemoradiotherapy in patients with rectal cancer
Article information
Abstract
Purpose
Hematotoxicity following anti-cancer treatment is known to be related to treatment efficacy in several malignancies. The purpose of this study was to examine the hematologic parameters related to the tumor response and survival in patients treated with curative surgery following preoperative chemoradiotherapy (CRT) for rectal cancer.
Materials and Methods
Four hundred eighteen patients with rectal cancer who underwent preoperative CRT and curative surgery were analyzed, retrospectively. The main clinical factors and blood cell counts before and after CRT were investigated with respect to their relationships with tumor downstaging and patient survival.
Results
The post-CRT leukocyte count was significantly different between the tumor downstaging group and the nondownstaging group (median, 4740/uL vs. 5130/uL; p = 0.013). Multivariate analysis showed that histological grade, circumferential extent, and post-CRT leukocyte count were related to tumor downstaging. In addition, histological grade, post-CRT leukocyte count, and tumor downstaging were related to disease-free survival. The 5-year disease-free survival and overall survival in patients with post-CRT leukocyte count ≤3730/uL, which is the cut-off value derived from the receiver operation characteristic (ROC) curve analysis, were significantly higher than those with higher counts (88.0% vs. 71.6%, p = 0.001; 94.4% vs. 84.1%, p = 0.024).
Conclusion
Post-CRT leukocyte count of ≤3730/uL could be regarded as a good prognostic factor for tumor response and survival in rectal cancer patients treated with preoperative CRT.
Introduction
Hematologic toxicity such as neutropenia and leukopenia during or after chemotherapy has been reported to be a useful independent biomarker for predicting survival in patients with cancers such as non-small cell lung cancer, gastric cancer, breast cancer, Hodgkin’s disease, and colorectal cancer [1-6]. In a retrospective study of metastatic colorectal cancer, patients with severe neutropenia during chemotherapy had a median survival of 26 months, while those without neutropenia had a median survival of 13.6 months [7].
In addition to hematologic toxicity, several hematologic parameters such as hemoglobin level, the proportion of lymphocytes among white blood cells (WBC), and the ratio of neutrophil to lymphocyte have been reported to be related to treatment efficacy in rectal cancer patients. In several retrospective studies, high hemoglobin levels before and during chemoradiotherapy (CRT) for rectal cancer had a relationship with improved tumor response and survival [8,9]. Other studies have suggested that rectal cancer patients with higher proportions of lymphocytes among their WBCs and lower neutrophil to lymphocyte ratios had more favorable survival rates than those without these characteristics [10,11].
In this study, we retrospectively evaluated the alteration of hematologic parameters during neoadjuvant chemoradiotherapy in patients with rectal cancer and found useful hematologic parameters for predicting treatment efficacy, including tumor response and survival.
Materials and Methods
1. Patients
Neoadjuvant concurrent CRT was performed in 507 patients who had locally advanced rectal cancer or distal rectal cancer for which an abdominoperineal resection is thought to be necessary, at Samsung Medical Center between July 1999 and March 2009. Of the 507 patients, 31 who had distant metastasis at the time of first diagnosis, 18 who did not undergo curative rectal surgery, and 40 who received reduced chemotherapy for poor performance status were excluded from this investigation. The remaining 418 patients with rectal cancer were analyzed in terms of tumor downstaging and survival.
Also, additional 212 patients treated from April 2009 to December 2010 were evaluated to verify the impact of post-CRT leukocyte count on tumor downstaging and tumor regression grade (TRG) suggested by Mandard et al. [12]. Of these, 8 had distant metastasis at initial staging work ups, 11 underwent reduced chemotherapy, 8 underwent S-1 chemotherapy, and 17 did not receive curative surgery. Remaining 168 patients were analyzed for verification.
All patients underwent digital rectal examination, chest X-ray, colonoscopy, and abdominal and pelvic computed tomography (CT) scans before beginning neoadjuvant CRT. Of them, 227 patients (54.3%) underwent pelvic magnetic resonance imaging scans as staging work ups. In all patients, complete blood cell counts (CBC) including hemoglobin, leukocyte, and leukocyte subsets were evaluated within 2 weeks before the start of both CRT and surgery. Informed consent for the treatments was collected from all patients, and this study was approved by the Institutional Review Board of Samsung Medical Center (IRB No. SMC201410134).
2. Treatment
The radiation dose was a total of 44–45 Gy with 1.8–2 Gy per fraction, using one posterior beam and two bilateral beams with 4–10 megavoltage photons. The radiation field was the whole pelvis, including the primary tumor and the regional lymphatic area with customized portals. In all patients, chemotherapy was delivered concurrently with radiotherapy (RT) consisting of a bolus injection of 5-fluorouracil, 500 mg/m2/day for 3 days per cycle for the first and last week of RT or capecitabine, 850 mg/m2/day twice daily for 5 days per week for 5 weeks. Adjuvant chemotherapy was administered to all but 88 of the patients. All of the subjects underwent curative surgery 6–8 weeks after the end of the CRT, including low anterior resection in 357 patients, abdominopelvic resection in 80 patients, and local excision in 21 patients. After surgery, all tumor specimens were examined by a pathologist, and the post-CRT pathologic stage was evaluated. Well or moderately-differentiated tumors were classified as low grade tumor, and poorly differentiated tumor, mucinous carcinoma or signet ring cell carcinoma were classified as high grade tumor [13,14]. The TNM stage system according to the 7th edition of the American Joint Committee on Cancer was used in staging. Tumor downstaging was determined by comparing the pretreatment clinical and the postoperative pathological T and N classifications and defined as lower pathological stage than pretreatment stage. For example, patients with clinical stage III and pathological stage III were classified as non-downstaging group, while patients with clinical stage III and pathological stage II were classified as downstaging group.
3. Follow-up and assessment of disease recurrence
Patient follow-ups by a colorectal surgeon, radiation oncologist, or medical oncologist were performed every 3 months for the first 2 postoperative years and every 6 months thereafter. Physical examination, digital rectal examination, complete blood count, liver function test, and the carcinoembryonic antigen (CEA) value assessment were performed as follow-up evaluations. Chest radiography and CT of the abdomen and pelvis were conducted every 6 months after treatment, and colonoscopy or sigmoidoscopy were performed every year after surgery. Suspected lesions of recurrence were proven pathologically by biopsy and/or clinically by close follow-up imaging showing an increase in size over time.
4. Statistical analyses
The enrolled patients were divided into two groups: the downstaging group (DG) and the non-downstaging group (NG). The patient and tumor characteristics between DG and NG were compared using the chi-square test or Fisher exact test for categorical variables and the Mann-Whitney U-test for continuous variables. The alterations of blood test data between the pre-CRT and post-CRT phases were evaluated using the Wilcoxon signed-rank test. A receiver operating characteristic (ROC) curve was used to define the cut-off point for the continuous variable that was related to tumor downstaging. Multivariate stepwise logistic regression analysis was used to determine the correlations between main potential parameters and tumor downstaging. The disease-free survival (DFS) curves and overall survival (OS) curves according to main potential parameters were estimated using the Kaplan-Meier method. The difference between the survival curves were evaluated in a univariate manner with the log-rank test and in a multivariate manner with the Cox’s proportional hazards model. All statistical analyses were performed using SPSS software ver. 20.0 (IBM, Armonk, NY, USA). A two-sided p-value of <0.05 was considered statistically significant.
Results
1. Patient characteristics
The median follow-up period was 52 months (range, 5 to 138 months). The DG and NG included 215 patients and 203, respectively. The patient characteristics of the two groups are shown in Table 1. The main clinical and pathological factors did not significantly differ between the two groups, with the exception of clinical T stage, the histological grade, circumferential extent, and pretreatment CEA level. The patients in DG had more tumors with low grade and short circumferential extent and showed lower pretreatment CEA level than the patients in NG.

Patient’s characteristics according to the tumor response after concurrent chemotherapy in preoperative rectal cancer patients
2. Blood cell data
The blood cell data was evaluated before and after the CRT. The second blood test was performed on median 39 days (range, 28 to 55 days) after the end of CRT. The data variation over time did not differ between the DG and NG, except for the post-CRT leukocyte count, post-CRT monocyte count, and the reduction ratio of leukocytes (Table 2). The post-CRT leukocyte count had a median of 4740/uL (range, 1200/uL to 18370/uL) in DG and a median of 5130/uL (range, 2210/uL to 13220/uL) in NG (p = 0.013) (Fig. 1). The reduction ratio of leukocyte count had a median of -31% (range, -83% to 134%) and a median of -26.5% (range, -71% to -62%) in the DG and NG groups, respectively (p = 0.042). The post-CRT monocyte counts were lower in DG than in NG, significantly (median, 395/uL and 439/uL, respectively; p = 0.012). However, the reduction ratio of monocyte counts were not different between the two groups (p = 0.476).
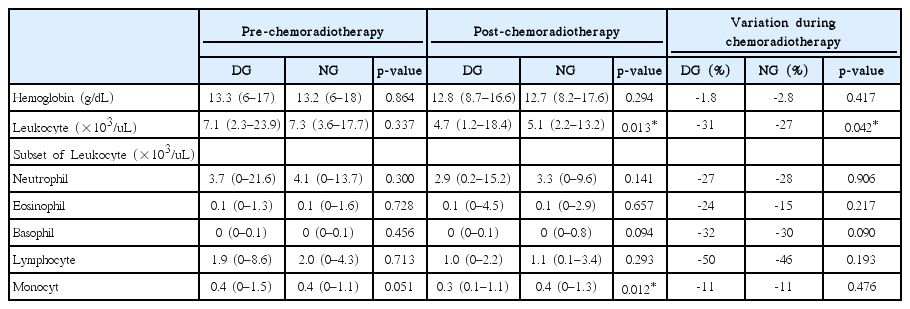
Hematologic changes according to tumor response at pre-chemoradiotherapy and post-chemoradiotherapy

Median post-CRT leukocyte counts. CRT, chemoradiotherapy; DG, downstaging group; NG, non-downstaging group.
The leukocyte count and the percent of lymphocyte were significantly reduced from pre-CRT to post-CRT in both DG and NG (p < 0.001). On the other hand, the percent of neutrophils and the ratio of neutrophils to lymphocytes were significantly increased between the two time periods irrespective of the incidence of downstaging (p < 0.001).
3. Predictive factors for tumor downstaging
The major clinical and hematological parameters which showed a significant difference between the DG and NG were analyzed using a multivariate model (Table 3). The cut-off post-CRT leukocyte value derived from ROC curve analysis for predicting the downstaging was 3730/uL, and all of the patients were divided into two groups based on the cut-off value (p = 0.003; AUC = 0.583; Youden’s index = 0.133; 95% confidence interval, 0.534–0.631) (Fig. 2). The histological grade, tumor circumferential extent, and post-CRT leukocyte value were independently related to tumor downstaging. There was a particularly favorable rate of downstaging, with an odds ratio of 2.698, with post-CRT leukocyte count of ≤3730/uL, as compared to cases where counts were >3730/uL.
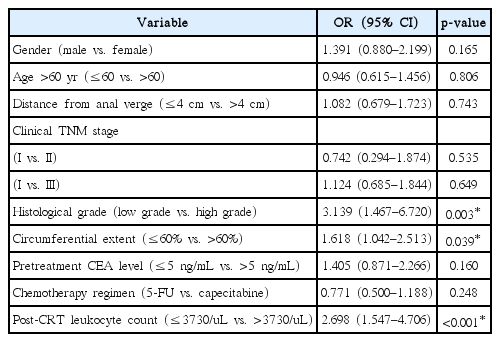
Multivariate analysis for tumor downstaging
A receiver operating characteristic (ROC) curve of post-CRT leukocyte counts in predicting the tumor downstaging. CRT, chemoradiotherapy.
4. Prognostic factors for patient survival
Table 4 showed the prognostic factors for patient disease-free survival and overall survivial. Histological grade, circumferential extent of tumor, pretreatment CEA level, post-CRT leukocyte count, and tumor downstaging were related to DFS in univariate analyses. Multivariate analyses showed that histological grade, post-CRT leukocyte count, and tumor downstaging were independent factors (p = 0.042, 0.003, and 0.001, respectively). The 5-year DFS rate was 88.0% in patients with post-CRT leukocyte counts of ≤3730/uL and 71.6% in patients with higher counts (Fig. 3A).
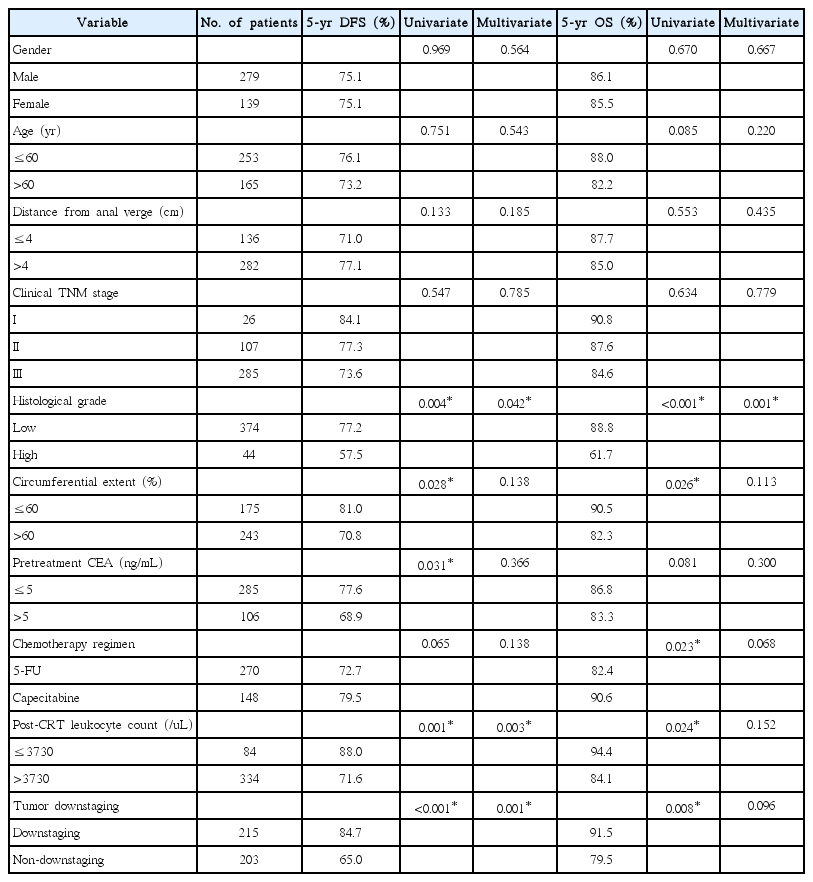
Univariate and multivariate analysis with prognostic factors for survivals

Disease-free survival (A) and overall survival (B) curves according to the post-CRT leukocyte count. The patients with lower post-CRT leukocytes had significantly more favorable disease-free survival and overall survival than those with higher post-CRT leukocyte counts. CRT, chemoradiotherapy.
The histological grade, circumferential extent, chemotherapy regimen, post-CRT leukocyte count, and tumor downstaging showed significant correlation with OS rate. Multivariate analyses for OS revealed that a high grade of tumor was an independent poor prognostic factor (p = 0.001). The 5-year OS rate was high in patients with post-CRT leukocyte counts of ≤3730/uL, compared with patients with higher counts (94.4% vs. 84.1%; p =0.024) (Fig. 3B).
5. Verification of relationship between post-CRT leukocyte count and tumor response
In the verification analysis of additional 168 patients, the impact of post-CRT leukocyte count on tumor response was verified. The lower post-CRT leukocyte group with the count of ≤3730/uL had more tumor downstaging than the higher group, significantly (77.1% vs. 57.1%; p = 0.026) (Table 5). There was no significant difference of TRG between the two groups, though the lower leukocyte group had tendency of having higher TRG.
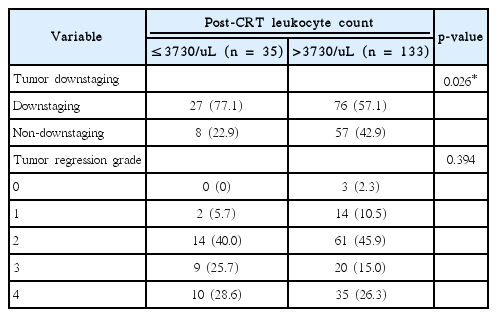
Verification of relationship between post-CRT leukocyte count and tumor response
Discussion and Conclusion
CBC count is tested in an inexpensive, reliable, reproducible, and standardized manner and is a biological marker proven to be a prognostic factor for several systemic and solid malignancies. Numerous studies showed that pretreatment CBC count and its components could be prognostic tools in various type of tumors with some being used as prognostic score components—e.g. leukocyte count in the International Prognostic Score (IPS) of Hodgkin’s lymphoma [15]. In addition to leukocyte count, the absolute neutrophil count, the neutrophil to lymphocyte ratio, the absolute lymphocyte count, the absolute monocyte count, the hemoglobin concentration, and the platelet count have been suggested to be prognostic factors in particular malignancies [16-22].
There are several reports that the post-treatment CBC count or hematotoxicity following chemotherapy, radiotherapy, and immunotherapy are related to treatment efficacy including tumor response and patient survival. Leukopenia following chemotherapy was revealed to be related with patient survival in studies of breast cancer. Saarto et al. [23] demonstrated that patients with a lower leukocyte nadir during chemotherapy for node-positive stage II and III breast cancer had significantly better disease-free and OS rates (p = 0.006 and p = 0.04, respectively). Median DFS and OS time for leukocyte nadirs ≥4000, 3000–3900, and <3000 were 80 and 116 months, 90 and 111 months, and 126 and 128 months, respectively. The authors suggested that the leukocyte nadir could be used as a marker for therapy efficacy and as tools for establishing an optimal chemotherapy dose intensity for individual patients. Poikonen et al. [4] also showed that a low leukocyte nadir was related to a long DFS in breast cancer patients receiving adjuvant chemotherapy in univariate analyses, though not in multivariate analyses. A German Hodgkin Study Group demonstrated a correlation between severe leukopenia during chemotherapy and reduced treatment failure in 4,626 Hodgkin’s disease patients [5]. At a median follow-up time of 66 months, the female patients had a higher prevalence of severe leukopenia and showed a better failure-free survival rate than male patients (69.9% vs. 55.2%, and 81% vs. 74%, respectively). Severe leukopenia was associated with better overall survival in both males and females.
Of the different leukocyte subsets, neutropenia during anti-cancer treatment was proposed to be a prognostic marker in various cancer types. In a pooled analysis of 1,265 patients with advanced non-small cell lung cancer, the hazard ratios of death were 0.65 for patients with severe neutropenia and 0.74 for those with mild neutropenia during chemotherapy [24]. Shitara et al. [7] retrospectively analyzed 153 patients with metastatic colorectal cancer who received FOLFOX as first-line chemotherapy. Of these patients, severe neutropenia during chemotherapy occurred in 46 patients (30%) and mild neutropenia occurred in 60 patients (39%), with hazard ratios of deaths of 0.35 and 0.55, respectively.
In our study, low post-CRT leukocyte count was related to favorable tumor response with the cut-off point established to be 3730/uL, lower than the definition value of leukopenia. Interestingly, post-CRT leukocyte count was related to not only tumor downstaging, but also disease-free survival independent of tumor downstaging. Low post-CRT leukocyte count was also found to be related to treatment outcome in breast cancer and Hodgkin’s disease, irrespective of clinical stage or the type of chemotherapy concurrently used with the RT. It is unclear whether leukopenia is only a secondary phenomenon of other prognostic factors like tumor extent or fundamental mechanistic events reflecting the patient’s survival. Considering that the alteration of leukocytes and neutrophils occur in patients with early stage gastric cancer and uterine cervical intraepithelial neoplasm, the role of leukopenia in predicting the oncologic outcome cannot be excluded [25,26].
According to our results, post-CRT leukopenia might be a clinically applicable therapeutic determinant to adjust dose-intensity of adjuvant chemotherapy. Patients with post-CRT leukopenia and a good tumor response may expect a better oncologic outcomes by toxicity based dose reduction, which might reduce expected hematotoxicity and preserve tumor control. On the other hand, the outcome of patients who do not experience leukopenia might be improved by dose-escalation of adjuvant chemotherapy.
Leukocytes supplement using nutritional support or granulocyte colony stimulating factor (G-CSF) are considered when severe leukopenia develop during or after CRT. G-CSF treatment could increase the OS rate by reducing the severity and duration of neutropenic complications while maintaining the prescribed chemotherapy dose intensity [27]. However, G-CSF therapy may promote tumor growth in certain malignancies and may also increase the probability of developing secondary malignancies [28]. Further studies are needed to determine the effect of leukocyte supplementation on tumor response and survival in patients with leukopenia following CRT for rectal cancer.
The possible mechanism behind the correlation between leukopenia during anti-cancer therapy and a favorable oncologic outcome could be explained by two theories. First, the accessibility of therapeutic agents to the cancer cell might be similar in normal tissue cells, including the blood stem cells in bone marrow that produce the blood cell precursors, because each individual has the same microvascular environment in both normal and tumor tissue. Second, there might be an inherent sensitivity in cancer cells to the anti-cancer agent. Supposing the sensitivity of cancer cells to anti-cancer therapy is based on genetic predisposition, this would be the same in an individual’s normal tissue cells. As far as the authors know, it is not known which treatment of concurrent chemoradiotherapy for pelvic malignancy is the primary cause of leukopenia.
This is the first report to show that leukopenia is associated with tumor downstaging and favorable survival in rectal cancer patients treated with preoperative CRT. However, first limitation to this study is that, although the CBC was collected within 2 weeks before both the start of CRT and surgery, the collection points differed among the enrolled patients, a consequence of the retrospective design of this study. Second limitation is that tumor downstaging was determined by comparing the clinical and the pathological stage, which may result in inaccuracy in evaluating the true tumor response. This may be the reason for the non-significance of neutrophil count in this study, which is proven predictor and prognosticator in other studies. Third limitation is that the AUC and Youden’s index are low in the ROC curve analysis of the post-CRT leukocyte, which may represent a low accuracy of the proposed cut-off value.
In conclusion, a post-CRT leukocyte count ≤3730/uL might be a useful prognostic factor to predict tumor response and increase survival in rectal cancer patients treated with preoperative CRT and curative surgery. It might be considered to reduce the adjuvant chemotherapy after surgery when the patients show a post-CRT leukocyte count ≤3730/uL and good tumor response with preoperative CRT for rectal cancer. Next, it might be interesting to examine the effects of supplementing with leukocytes when the leukocyte count decreases to less than the cut-off level during CRT and to assess whether this affects tumor response and patient survival.
Notes
Conflict of Interest
No potential conflict of interest relevant to this article was reported.