Dosimetric comparison between modulated arc therapy and static intensity modulated radiotherapy in thoracic esophageal cancer: a single institutional experience
Article information
Abstract
Purpose
The objective of this study was to compare dosimetric characteristics of three-dimensional conformal radiotherapy (3D-CRT) and two types of intensity-modulated radiotherapy (IMRT) which are step-and-shoot intensity modulated radiotherapy (s-IMRT) and modulated arc therapy (mARC) for thoracic esophageal cancer and analyze whether IMRT could reduce organ-at-risk (OAR) dose.
Materials and Methods
We performed 3D-CRT, s-IMRT, and mARC planning for ten patients with thoracic esophageal cancer. The dose-volume histogram for each plan was extracted and the mean dose and clinically significant parameters were analyzed.
Results
Analysis of target coverage showed that the conformity index (CI) and conformation number (CN) in mARC were superior to the other two plans (CI, p = 0.050; CN, p = 0.042). For the comparison of OAR, lung V5 was lowest in s-IMRT, followed by 3D-CRT, and mARC (p = 0.033). s-IMRT and mARC had lower values than 3D-CRT for heart V30 (p = 0.039), V40 (p = 0.040), and V50 (p = 0.032).
Conclusion
Effective conservation of the lung and heart in thoracic esophageal cancer could be expected when using s-IMRT. The mARC was lower in lung V10, V20, and V30 than in 3D-CRT, but could not be proven superior in lung V5. In conclusion, low-dose exposure to the lung and heart were expected to be lower in s-IMRT, reducing complications such as radiation pneumonitis or heart-related toxicities.
Introduction
Esophageal cancer is one of the cancers with the high incidence and is associated with high mortality. According to the Surveillance, Epidemiology, and End Results data, the percent of surviving 5 years is about 18.8% and the number of death is 15,690 in 2017 that is 2.6% of all cancer deaths [1]. Especially, esophageal cancer can lead to high morbidity related to the functional outcomes. The National Comprehensive Cancer Network Guidelines recommend the use of fluoropyrimidine or taxane-based chemoradiation if the tumor is not a surgical candidate in cases of clinical stage T1b cancer with regional node metastasis or stage ≥T2 with any N stage [2].
In three-dimensional conformal radiotherapy (3D-CRT) planning of esophageal cancer with prescribed dose more than 45 Gy, portal change is required because of the limited dose in spinal cord. As radiotherapy (RT) technology developed, normal surrounding tissues could be preserved with intensitymodulated radiotherapy (IMRT) [3]. However there has been concern about increasing low-dose radiation exposure to the lung [4]. In addition to the high dose, there are reports that low-dose exposure to the lung is also related to the risk of RTinduced complications [5,6].
In representative methods for IMRT, a step-and-shoot static technique uses multiple multi-leaf collimator (MLC) shapes per field, while an arc technique utilizes dynamic field shaping using an MLC. The advantage of step-and-shoot IMRT (s-IMRT) is that portal verification of the intensity pattern is feasible, the relative accelerator control system is simple, and both forward and inverse planning are possible. However, the treatment time is long because of the large number of segments involved. On the other hand, intensity-modulated arc therapy (IMAT) has advantages of that the beam delivery time is fast and the dose distribution results in a smooth intensity pattern and better distribution on the target volume. Arc therapy, such as volumetric-modulated arc therapy (VMAT) or RapidArc, has a constant dose delivery capability. That is, while the gantry and the MLC are moving, the radiation dose is continuously delivered. In this regard, there has been concern regarding whether IMAT can be delivered safely and accurately on a linear accelerator.
The modulated arc therapy (mARC) as one of IMAT provides rotary hybrid IMRT radiation in burst mode. While the gantry rotates around the patient and RapidArc or VMAT are dynamically irradiated so that the beam is turned on as the MLC changes shape, the mARC technique seeks an intermediate approach. The 'beam-on' phase is separated from the MLC movement while maintaining continuous gantry rotation around the patient [7] (Fig. 1). The configuration of the MLC changes when the radiation is turned off between two consecutive control points. Between the next two control points, the doses are delivered continuously through a small arclet with the MLC configuration fixed. This provides high dose accuracy because the treatment planning system typically calculates the dose based on static fields.
Compared with the continuous dose delivery utilized in arc therapy, the mARC technique has the advantage of better plan optimization since no intermediate configuration is irradiated. Furthermore, compared with s-IMRT, the continuous rotation of the gantry and MLC can significantly reduce the treatment time. These advantages make RT planning suitable for preserving the organ-at-risk (OAR) and optimizing planning target volume (PTV) coverage depending on the location and characteristics.
RT planning for esophageal cancer differs depending on the location of target. The esophagus is divided into the cervical esophagus with relatively low lung volume, the thoracic esophagus with a lot of lung volume, and the lower esophagus with the liver, stomach, and bowel below the diaphragm. Several previous studies have compared VMAT and IMRT, in cervical esophageal cancer [8,9]. There are papers related to the use of these techniques for thoracic esophageal cancer treatment, but no significant result has been reported [4,10]. And mARC, which is technically different from VMAT, has not been thoroughly evaluated so far. In this study, we performed dosimetric comparison of 3D-CRT, s-IMRT, and mARC therapy for thoracic esophageal cancer with a radical aim. We aimed to analyze whether IMRT could reduce OAR dose through optimal selection of treatment modality.
Materials and Methods
1. Patients
From September 2013 to October 2016, 19 patients were treated with esophageal cancer as a radical intent at Department of Radiation Oncology of Seoul St. Mary's Hospital, Korea. Ten of them were thoracic esophageal cancer and enrolled in this study. Thoracic esophageal cancer was defined as upper and middle thoracic esophagus which bounded superiorly by the sternal notch and inferiorly by the inferior pulmonary vein. The patients were diagnosed with esophageal cancer of the histologically squamous cell carcinoma. All primary masses and involved nodes were located in the thoracic esophagus and none of the patients had a history of thoracic RT or surgery.
2. Target delineation and definition of OAR
Patients were immobilized in a supine position and scanned using the Somatom Sensation Open helical scanner (Siemens Medical Solutions, Erlangen, Germany) for RT planning. Computed tomography (CT) images were obtained at 3 mm per slice under free-breathing and the total lung and heart were scanned for further plan evaluation.
Gross tumor volume (GTV), clinical target volume (CTV), and PTV were contoured by a physician according to the details below. GTV included the gross tumor and involved nodes defined through diagnostic CT. GTVp was defined as the primary tumor in the esophagus and GTVn was defined as the grossly involved regional lymph nodes. CTV was composed of GTVp with 4–5 cm expansion in the superior and inferior directions along the length of the esophagus and 1–1.5 cm radial expansion and GTVn with 1–1.5 cm expansion in all dimensions. PTV was delineated with a 0.5 cm margin from CTV. The spinal cord, lung, and heart were contoured as OARs on each image.
3. Planning techniques and objectives
For each of the 10 patients, three different plans were implemented: 3D-CRT, s-IMRT, and mARC. The RT planning system was implemented with the Prowess Panther v5.2 (Prowess Inc., Concord, CA, USA) for the mARC and the Pinnacle planning system (Philips Healthcare, Fitchburg, WI, USA) was used for 3D-CRT and s-IMRT. Dose calculation was performed with 10 MV Siemens ARTISTE linear accelerators. A dose of 60 Gy of PTV in 30 fractions was prescribed in all treatment plans. The highest priority for inverse planning was ≥95% PTV coverage to achieve 95% of the prescribed dose and a maximum dose lower than 110% of the prescribed dose. The goals of the OAR dose volume in inverse planning were defined as follows: maximum dose for the spinal cord <45 Gy; lung V20 <30%; mean lung dose <20 Gy; and mean heart dose <30 Gy. The aim of this study was to investigate the difference of lung and heart dose under dose limits as shown above. To evaluate this, lung V5, V10, and V30 and heart V30, V40, and V50 were evaluated.
The 3D-CRT plan was consisted of 36 Gy for an anteroposterior and postero-anterior approach and 24 Gy for portal change to spare the spinal cord. When the portal change was performed, we planned to use the three portals that can reach the above goal with the maximum cord dose <45 Gy and the coverage of PTV and OAR. In s-IMRT planning, 7–10 beams were arranged using 10 MV photon energy for coplanar inverse planning. The alignment of each beam was optimized for PTV coverage and OAR sparing. Five of the patients were treated using 7 beams, one using 9 beams, and four using 10 beams because the tumor was too large to achieve goal of inverse planning to OARs and target coverage. Inverse mARC planning was performed by clockwise rotation from 180º to 170º in a single arc, with 10 MV photon energy using 60 optimization points at 6º intervals. After the definition of the arc isocenter, collimator angle, and control points, optimization was performed.
4. Plan evaluation and comparison
For evaluation of the three RT plans, dose-volume histogram (DVH) data were extracted and parameters were calculated. In analysis of target coverage, we calculated the homogeneity index (HI), conformity index (CI), and conformity number (CN). The HI was defined in ICRU 83 [11] as follows:
This index represents the difference between the dose delivered to 2% of the target volume (D2%) and that delivered to 98% of the target volume (D98%) divided by 50% of the target volume (D50%). A value of zero is ideal and the closer the HI is to zero, the better the homogeneity. The CI is defined as
for the evaluation of target conformation [12]. The CN is defined as
TV, TVRI, and VRI represent the treatment volume, the treatment volume at reference isodose (RI) of the prescribed dose, and the total volume at RI of the prescribed dose, respectively. The RI was defined as 95% of PTV prescribed dose. The maximum value for CN is 1, corresponding to perfect PTV coverage.
5. Statistical analysis
For comparison between the three plans, Kruskal-Wallis tests were used. A p < 0.05 was considered to be statistically significant. All statistical analyses were performed using the SPSS software ver. 22.0 J (SPSS IBM Inc., Armonk, NY, USA).
Results
Planning for 3D-CRT, s-IMRT, and mARC was performed for the ten patients with thoracic esophageal cancer. The mean PTV volume was 413.88 ± 184.58 cm3, and the mean total volume of the lung and heart were 3,602.06 ± 869.26 cm3 and 678.39 ± 135.94 cm3, respectively. Table 1 summarizes the clinical stage, location of metastatic nodes, total volume and long axis for PTV, and the total volume of the lung and heart in each patient.
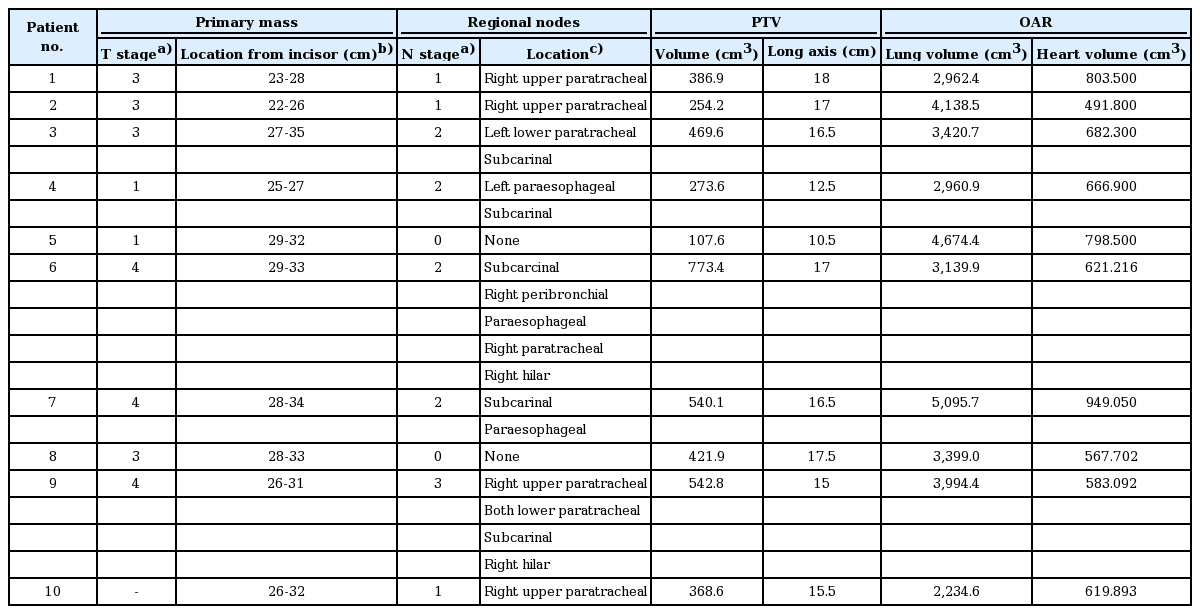
Characteristics of patients
Average of monitor units (MU) per fraction were 204.91 ± 12.14 in 3D-CRT, 837.52 ± 379.13 in s-IMRT, and 523.32 ± 71.53 in mARC (p < 0.001). The maximum PTV dose was 6,179.3 cGy (103%) in 3D-CRT, 6,559.8 cGy (109%) in s-IMRT, and 6,510.3 cGy (108%) in mARC (p = 0.001).
The CI was 0.31 in 3D-CRT, 0.56 in s-IMRT, and 0.81 in mARC, respectively (p = 0.050). The CN was 0.29 in 3D-CRT, 0.49 in s-IMRT, and 0.72 in mARC, respectively (p = 0.042). There was no significant difference in the HI calculated to evaluate the homogeneity of PTV in the three plans (3D-CRT vs. s-IMRT vs. mARC, 0.28 vs. 0.28 vs. 0.32; p = 0.833). The analysis of PTV is detailed in Table 2.
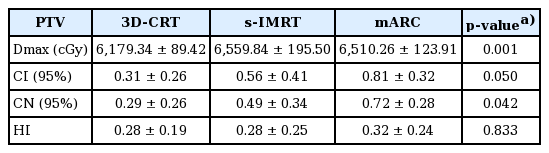
Analysis of target coverage
For the comparison of OAR, parameters for the total lung and heart were extracted from DVH. The mean lung dose were 1,177.80 cGy in 3D-CRT, 1,109.66 cGy in s-IMRT, and 1,112.53 cGy in mARC with no significant difference (p = 0.821). Lung V5 was lowest in s-IMRT (46.88%), followed by 3D-CRT (64.69%), and mARC (70.00%) with statistically significant difference (p = 0.033). Lung V10 was in the order of 33.43% in s-IMRT, 40.86% in mARC, and 46.94% in 3D-CRT (p = 0.082). Lung V20 was lowest in mARC (14.81%), followed by s-IMRT (17.24%) and 3D-CRT (19.40%). Lung V30 was also in the order of mARC (6.75%), s-IMRT (9.00%), and 3D-CRT (11.55%). These results showed that in lung V10, V20, and V30 analysis, s-IMRT and mARC were superior to 3D-CRT but this did not show significant difference (V10, p = 0.082; V20, p = 0.457; V30, p = 0.097). The comparison of OARs is summarized in Table 3.
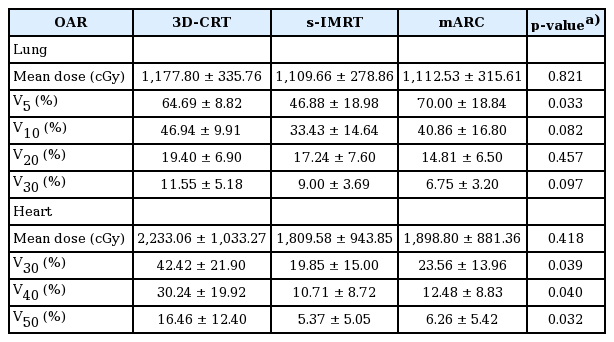
Organs at risk comparison
The mean dose delivered to the heart was 1,809.58 cGy in s-IMRT and 1,898.80 cGy in mARC, and 2,233.06 cGy in 3D-CRT (p = 0.418). Heart V30 showed 42.42% in 3D-CRT, 19.85% in s-IMRT, and 23.56% in mARC (p = 0.039). Heart V40 showed 30.24% in 3D-CRT, 10.71% in s-IMRT, and 12.48% in mARC (p = 0.040). Heart V50 showed 16.46% in 3D-CRT, 5.37% in s-IMRT and 6.26% in mARC (p = 0.032). The parameters in the DVH analysis of the heart showed the superiority of s-IMRT and mARC over 3D-CRT with significant.
Discussion and Conclusion
RT for esophageal cancer has been used for unresectable locally advanced esophageal cancer. Because the esophagus lacks a serosa layer and lymphatic spread is much more prevalent, longitudinal expansion of 4–5 cm is often required when defining the CTV. The longitudinal axis is long, and the lung or heart may be irradiated with a high dose. As a result, the risk of complications such as radiation pneumonitis (RP) or pericarditis is high. We aimed to compare the dose of lung and heart dose between 3D-CRT and IMRT and suggest more optimal treatment planning in thoracic esophageal cancer.
In our study, analysis of PTV coverage showed that CI and CN in mARC were better than in 3D-CRT. This indicated that PTV coverage was superior with arc therapy. Wu et al. [4] found that IMRT and VMAT had significantly superior CI and CN for PTV compared to 3D-CRT, but there was no significant difference between IMRT and VMAT. In this study, CI and CN in mARC were superior to the other two plans. CI represents the coverage for the target, CN reflects the coverage for the target and the dose distribution for the surrounding non-target area [12]. The CN is significantly higher if the surrounding nontarget area has less radiation dose and target coverage is high. As shown in the dose distribution of one patient (Fig. 2), the target coverage and non-target area savings are superior in mARC. The highest CN in mARC in our study seems to be due to the advantages of arc intensity, smooth intensity pattern and better distribution on the target volume.

Dose distribution of planning target volume in one patient. 3D-CRT, three-dimensional conformal radiotherapy; s-IMRT, static intensity modulated radiotherapy; mARC, modulated arc.
In studies of lung complications related to radiation dose, commonly reported parameters related to pulmonary toxicity were lung V20 and mean lung dose. The Quantitative Analysis of Normal Tissue Effects in the Clinic (QUANTEC) guidelines showed 20% risk of RP for a mean lung dose of 20 Gy. Kwa et al. [13] evaluated the mean lung dose in a multi-institutional study involving 540 patients. There was a report of RP with a mean lung dose of 5% at 0–8 Gy, 11% at 8.1–16 Gy, 17% at 16.1–24 Gy, and 43% at 24.1–36 Gy. And Emami et al. [5,6] described the 5% incidence of symptomatic pneumonitis when lung V5 was <42%. These results suggested that low-dose exposure in the lung was associated with RP. About heart dose and heart-related toxicities, the QUANTEC guideline for heartrelated toxicities indicates that long-term cardiac mortality is less than 1% with less than 10% of heart V25. In addition, the rate of major coronary events has been reported to be linear with a mean dose to the heart with no apparent threshold, indicating dose-dependence [14].
In OAR analysis of our study, there was no difference in mean lung dose among the three plans. However, s-IMRT technique showed that it can lower the low dose of lung better than 3D-CRT or mARC. Lung V5 in s-IMRT was statistically significantly low and the average graph for lung DVHs of 10 patients (Fig. 3) showed that V10 tended to be low in s-IMRT. In previous Wu et al. [4] showed that 3D-CRT had lower lung V5 and V10 compared to IMRT and VMAT. IMRT and VMAT had significantly lower lung V30 than 3D-CRT. This study showed that IMRT and VMAT were not superior to 3D-CRT for preserving of lung in thoracic esophageal cancer. In our study, lung V5 and V10 in s-IMRT were lower than those in the other two plans. s-IMRT could sufficiently save surrounding lung while sufficiently maintaining target coverage. On the other hand, lung V5 in mARC was higher than that in 3D-CRT. This showed that mARC could not lower the low dose volume which was one of characteristics in the arc therapy.
The dose-volume histogram of PTV (A), lung (B), and heart (C) for average in 10 patients. PTV, planning target volume; 3D-CRT, three-dimensional conformal radiotherapy; s-IMRT, static intensity modulated radiotherapy; mARC, modulated arc.
s-IMRT and mARC had lower values than 3D-CRT for the mean dose, V30, V40, and V50 in the heart. Wu et al. [4] demonstrated that there was no statistically significant difference in heart-related parameters except heart V30. In our study, all parameters in the DVH analysis of the heart showed the superiority of s-IMRT and mARC over 3D-CRT with significant. We found that heart preservation effect was better with s-IMRT and mARC than with 3D-CRT. This suggests that IMRT is superior to 3D-CRT in the selection of radiotherapy for thoracic esophageal cancer, which may be a good alternative therapy for patients with underlying cardiac problems.
Esophageal cancer in the cervical area has relatively low lung volume and is far from the heart. Consequently, RTrelated complications that affect the surrounding organs are relatively low and the supraclavicular field is included, making IMRT planning superior to 3D-CRT with regard to target conformation. However, IMRT planning such as stepand- shoot or arc technique of esophageal cancer located in the thoracic level has been concerned about a high volume of low-dose radiation exposure to the lung. Lower esophageal cancer is closer to the heart and the lower lobe of the lung and can affect the kidneys and liver. Lin et al. [15] performed DVH analysis for IMRT and VMAT according to the location of esophageal cancer. In DVH analysis for thoracic esophageal cancer RT planning, the mean lung dose for IMRT was significantly lower than that for VMAT. The difference of lung V20 between IMRT and VMAT in the thoracic esophagus was much more compared with those in the upper and lower esophagus. The mean dose delivered to the heart in lower esophageal cancer was significantly lower with VMAT. This suggests that the RT plan for esophageal cancer has different advantages and disadvantages depending on the tumor location.
In this study, we demonstrated that effective conservation of the lung in thoracic esophageal cancer could be expected in s-IMRT. The mARC was lower in lung V10, V20, and V30 than in 3D-CRT, but could not be proven superior in lung V5. Therefore mARC could be considered selectively in cases where the target volume is smaller and further research is needed. In conclusion, low-dose exposure to the lung and heart were lower in s-IMRT, reducing complications such as RP or heartrelated toxicities. We expected that s-IMRT could be employed as feasible alternative to 3D-CRT for the treatment of thoracic esophageal cancer.
Notes
Conflict of Interest
No potential conflict of interest relevant to this article was reported.