FDG-PET/CT as prognostic factor and surveillance tool for postoperative radiation recurrence in locally advanced head and neck cancer
Article information
Abstract
Purpose
To evaluate the prognostic value of metabolic tumor volume (MTV) and maximum standardized uptake value (SUVmax) on initial positron emission tomography-computed tomography (PET-CT) and investigate the clinical value of SUVmax for early detection of locoregional recurrent disease after postoperative radiotherapy in patients with locally advanced head and neck squamous cell carcinoma (HNSCC).
Materials and Methods
A total of 100 patients with locally advanced HNSCC received primary tumor excision and neck dissection followed by adjuvant radiotherapy with or without chemotherapy. The MTV and SUVmax were measured from primary sites and neck nodes. The prognostic value of MTV and SUVmax were assessed using initial staging PET/CT (study A). Follow-up PET/CT scan available after postoperative concurrent chemoradiotherapy or radiotherapy were evaluated for the SUVmax value and correlated with locoregional recurrence (study B). A receiver operating characteristic (ROC) curve analysis was used to define a threshold value of SUVmax with the highest accuracy for recurrent disease assessment.
Results
High MTV (>41 mL) is negative prognostic factor for disease free survival (p = 0.041). Postradiation SUVmax was significantly correlated with locoregional recurrence (hazard ratio, 1.812; 95% confidence interval, 1.361 to 2.413; p < 0.001). A cut-off value of 5.38 from follow-up PET/CT was identified as having maximal accuracy for detecting locoregional recurrence by ROC analysis.
Conclusion
MTV at staging work-up was significantly associated with disease free survival. The SUVmax value from follow-up PET/CT showed high diagnostic accuracy for the detection of locoregional recurrence in postoperatively irradiated HNSCC.
Introduction
Patients with locoregionally advanced head and neck squamous cell carcinoma (HNSCC) are generally treated with multimodality therapy consisting of surgery, radiotherapy, and chemotherapy. When surgery is the primary treatment for advanced HNSCC, surgery followed by adjuvant chemoradiotherapy is considered as the standard for neck disease with multiple lymph nodes or extracapsular extension or positive surgical margin [1,2]. For patients at high risk of locoregional recurrence, risk assessment and proper surveillance including physical examination and reliable imaging, could potentially improves survival. The prognostic and diagnostic value of positron emission tomography/computed tomography (PET/CT) is increasingly interested in patients with recurrent HNSCC [3-8]. Recent studies show that maximum standardized uptake value (SUVmax) or metabolic tumor volume (MTV) from PET/CT may be useful to predict recurrence in patients with head and neck cancer treated with concurrent chemoradiotherapy [9-12]. PET/CT also has high specificity and sensitivity for detecting recurrent disease. For both definitive concurrent chemoradiotherapy and radical surgery, this suggests possible benefit for the determination of treatment response and for the early detection of recurrence. However, post-treatment changes such as inflammation and fibrosis might result in relatively low positive predictive value for detecting recurrence [7,13,14].
We performed two analyses using PET/CT focused on locoregional recurrence in HNSCC patients treated with surgery followed by adjuvant radiotherapy. First, we investigated the value of MTV and SUVmax at staging workup for predicting recurrence. Second, we examined the diagnostic accuracy of PET/CT in the detection of post-treatment recurrence.
Materials and Methods
1. Inclusion criteria and patient characteristics
This retrospective study was approved by the Institutional Review Board of the Catholic University of Korea. Informed consent was waived due to the retrospective design of the study. Between May 1994 and April 2009, a total of 100 patients with locally advanced HNSCC received primary tumor excision and neck dissection followed by adjuvant radiotherapy with or without chemotherapy. Criteria for patient inclusion into study A or B is showed at Table 1. There was 69 patients in study A who underwent a PET/CT scan as part of staging workup and 81 patients in study B who underwent a PET/CT as follow-up after completion of surgery and adjuvant radiotherapy. Of these, 50 of the 100 total patients underwent PET/CT imaging at both staging workup and follow-up. After completion of treatment, patients who had residual disease by clinical or radiographic evaluation were excluded from study B. The prognostic value of PET/CT on predicting disease free survival was investigated in study A and the clinical value of the early detection of post-treatment locoregional recurrence was evaluated in study B. Demographic and clinical characteristics for both study A and B are summarized in Table 2. Patients in both the study A and B had similar characteristics and received similar treatment with the exception of the time of PET/CT imaging and treatment response. Patient characteristics, including age (p = 0.499), gender (p = 0.734), primary site (p = 0.569), American Joint Committee on Cancer (AJCC) stage (p = 0.653), performance status (p = 0.131) between two studies were not significantly different by chi-square test. The majority of patients were middle-aged males who were heavy smoker with stage IV cancer treated with radical surgery (primary mass excision and bilateral neck dissection) with ≥60 Gy adjuvant chemoradiotherapy.
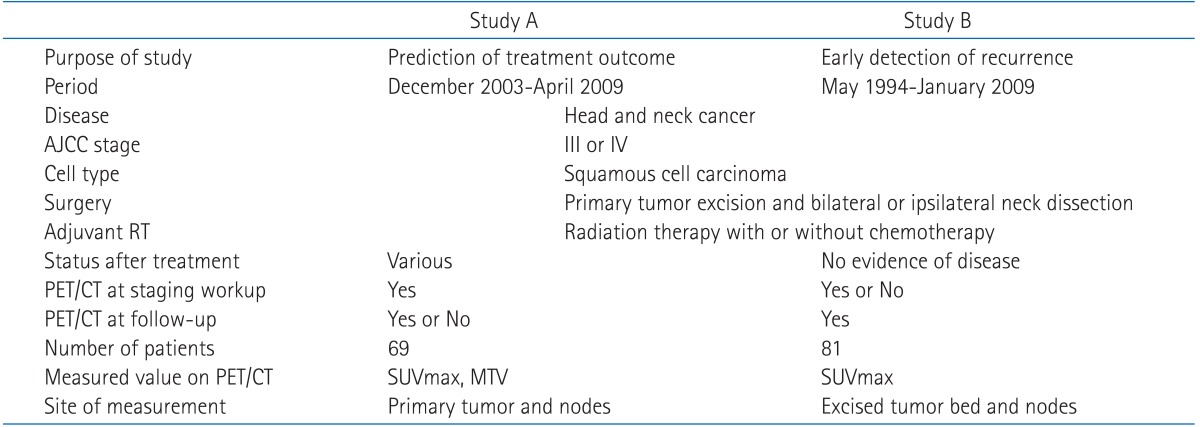
Inclusion criteria of study A and B

Patient characteristics
2. Treatments
The primary tumor excision and modified neck dissection were performed and followed by postoperative radiotherapy with or without chemotherapy in all patients. Radiotherapy was scheduled within 8 weeks after surgery. Radiotherapy was delivered via 3-dimensional technique. The prescribed dose was 1.8 to 2 Gy per fraction and given 5 days per week. The total radiation dose was given in 60 Gy (range, 32 to 70 Gy). A boost dose of 5-6 Gy was administered for patients with multiple positive neck nodes, extracapsular spread, and involved margin. Concurrent chemoradiotherapy with a schedule of weekly cisplatin (30 mg/m2) was administered to patients with extracapsular spread, multiple lymph nodes or positive margin [15].
3. Follow-up
Standard head and neck examination was performed in all patients during follow-up at 3-month intervals for the first 2 years and at 6-month intervals thereafter including flexible nasolaryngoscopy. The post-treatment PET/CT scan was recommended at usually 2 to 4 months after the completion of radiotherapy or concurrent chemoradiotherapy and then 6-month interval thereafter.
4. FDG-PET/CT imaging protocol
All patients fasted for at least 6 hours before the PET/CT study. An amount of 370-555 MBq of F-18 flourodeoxyglucose (FDG) was injected intravenously, and scanning began 60 minutes later. No intravenous contrast agent was used. Images were acquired on combined PET/CT in-line systems, either Biograph Duo or Biograph Truepoint (Siemens Medical Solutions, Knoxville, TN, USA). The acquisition time was 2 to 3 minutes per each bed position. All patients were in supine position with their arms raised. CT began at the orbitomeatal line and progressed to the upper thigh (130 kVp, 80 mAs, and 5 mm slice thickness; 120 kVp, 50 mAs, and 5 mm slice thickness). PET followed immediately over the same body region. The CT data were used for attenuation correction, and images were reconstructed using a standard ordered-subset expectation maximization (OSEM) algorithm. The axial spatial resolution was 6.5 mm or 4.5 mm at the center of the field of view.
5. Measurement of SUVmax and MTV
All PET/CT images were reviewed at a workstation with fusion software (Syngo; Siemens Medical Solution) that provided multiplanar reformatted images and displayed PET images after attenuation correction, CT images, and PET/CT fusion images. The images were closely searched for increased uptake in head and neck region by one physician who was board certified in both nuclear medicine and radiology. The SUVs were acquired using attenuation-corrected images. In initial PET/CT scans, the SUVmax of primary tumor and metastatic lymphadenopathies was obtained from transaxial views. In follow-up PET/CT scans, SUVmax was obtained from the postoperative tumor bed and dissected neck node. For patients with multiple sites of locoregional recurrence, the highest SUV was selected. The MTV of primary tumor and metastatic lymphadenopathies was measured using an automated contouring program (Siemens Medical Solutions). Of various methods for measurement of metabolic volume, a cut-off of SUV 2.5 was used. The boundaries were drawn large enough to incorporate target lesions in transaxial, coronal and sagittal views. Then isocontour connecting the lesion showing an SUV of 2.5 was set automatically inside the boundary, and all voxels with an SUV of >2.5 within the isocontour were included in MTV calculation [9,16].
6. Post-treatment surveillance and recurrence determination
After completion of postoperative radiotherapy, clinical examination and radiological imaging (CT or magnetic resonance imaging [MRI]) follow-up were performed by above mentioned interval. All patients in study B had no residual disease and underwent follow-up PET/CT at least once. The median time interval between adjuvant radiotherapy and follow-up PET/CT was 26.7 weeks. Determining locoregional recurrence was confirmed either pathologically or any failure detected by both physical examination with endoscopic evaluation and successive PET/CT or MRI. The first PET/CT data obtained during the period of suspected recurrence was used for patients with the recurrent disease.
7. Statistical analysis
Locoregional disease free survival (LRDFS), disease free survival (DFS) and overall survival (OS) from the date of surgery were estimated using the Kaplan-Meier method. To assess the discriminative power of MTV and SUVmax for predicting DFS, the log-rank test was used and comparison were made at each MTV and SUVmax level in the study A patients. Cox proportional hazards regression was used to determine independent predictors for DFS. SUVmax for patients with or without recurrence were compared using a Student's t-test (significance defined as p < 0.05). Logistic regression and receiver operating characteristic (ROC) was performed for PET/CT data of the study B for the highest value in either surgical bed or nodal site. Logistic regression was used in the multivariate analysis and an estimated hazard ratio (HR) with 95% confidence interval (CI) was presented. Polynomial curves were fit to the ROC data and solved for a slope of 1 to identify SUVmax cut-off value with maximum accuracy for detecting recurrence. A cut-off value of SUVmax, identified by the ROC curve, was used to calculate the sensitivity, specificity, positive predictive value (PPV), and negative predictive value (NPV) of follow-up PET/CT (significance defined as p < 0.05). Data were analyzed using SPSS version 12.0 (SPSS Inc., Chicago, IL, USA) in August 2009.
Results
1. Treatment outcomes
The median follow-up time for study A patients was 29.3 months (range, 4.1 to 68 months). Six patients in study A had persistent disease and their disease continued to progress after the completion of treatment. Two patients in study A developed distant metastasis at the end of treatment. The two-year OS rate for study A was 71%, DFS was 63.5%. The median follow-up time for study B patients was 35.4 months (range, 4.1 to 180.2 months). The two-year OS rate for patients in study B was 84.8% and locoregional DFS was 83.8%. There were 23 patients with recurrence (crude recurrence rate 28.4%), which occurred at locoregional sites in 8 patients, locoregional and distant sites in 8 patients, and at distant sites in 7 patients. The overall disease control rate for study B was 71.6% and the locoregional control rate was 80.2%.
2. Metabolic tumor volume predicting for disease free survival
We investigated prognostic factors related to recurrence for the patients in study A who underwent PET/CT at initial staging work-up. The median MTV in study A was 24.2 mL (range, 0.1 to 214.9 mL) and the median SUVmax in study A was 10.1 (range, 1.8 to 21.6). We first determined cut-off values of MTV and SUVmax correlating to DFS. Using log-rank test, significant p-values (p = 0.035) were obtained from 39 to 43 mL of MTV (Fig. 1A). The median value of MTV, 41 mL was used as the cut-off value for MTV. However, no value for SUVmax was significantly correlated with DFS (Fig. 1B). The lowest p-value (p = 0.249) was obtained at 10 of SUVmax. We examined whether MTV, SUVmax, and any patient characteristics were correlated with DFS. Using log-rank test, Eastern Cooperative Oncology Group (ECOG) performance status (p = 0.0016), vascular invasion (p = 0.0062), extracapsular spread (p = 0.0019), and MTV (p = 0.035) were significantly associated with DFS. In Cox's proportional hazards analysis, vascular invasion (positive: HR, 6.754; 95% CI, 0.812 to 56.198; p = 0.077) and extracapsular spread (positive: HR, 2.594; 95% CI, 0.595 to 11.317; p = 0.205) were not significantly correlated with DFS. However, ECOG performance status remained significant prognostic factors for DFS (HR, 3.553; 95% CI, 1.542 to 8.188; p = 0.003). MTV > 41 mL was associated with a 2.4-fold increased risk of recurrence or death (HR, 2.391; 95% CI, 1.037 to 5.511; p = 0.041) in advanced HNSCC patients treated with postoperative radiotherapy (Table 3). The two-year DFS for patients with MTV > 41 mL and MTV ≤ 41 mL was 48.3% and 70.7%, respectively (p = 0.035) (Fig. 2). Conversely, the two-year DFS of patients with SUVmax > 10 was not significantly different when compared with patients with SUVmax ≤ 10 (58.9% vs. 68.2%; p = 0.249).

Determination of cut-off values for (A) metabolic tumor volume (MTV) and (B) maximal standardized uptake value (SUVmax) correlated with disease free survival (DFS) in the study A. (A) The most significant cut-off value of MTV was identified at 41 mL (*p = 0.035). (B) Any SUVmax value was not statistically significant (p-value was obtained from log-rank test for DFS).

Analysis of prognostic factors for disease free survival (study A, n = 69). (A) Log rank test, (B) Cox's proportional hazards analysis
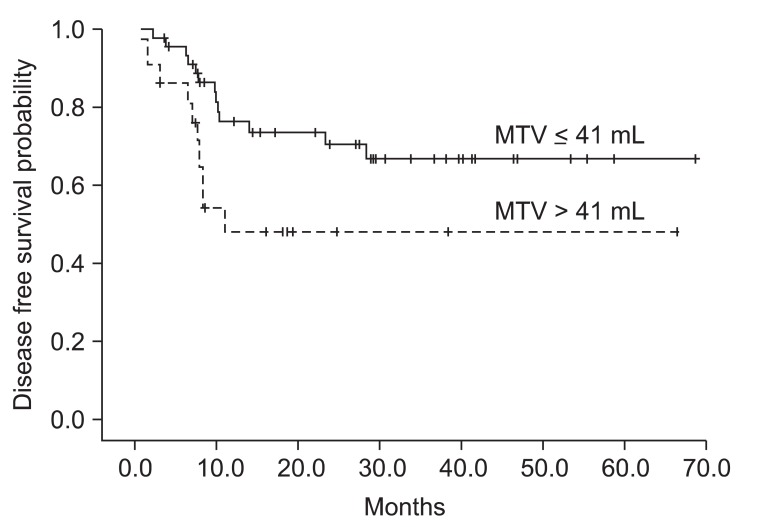
Disease free survival (DFS) curve according to 41 mL of metabolic tumor value (MTV) in the study A. DFS for patients with MTV ≤ 41 mL was significantly different between those with MTV > 41 mL (p = 0.035).
3. Correlating post-radiation SUV max with recurrence
Among 31 patients suspected locoregional recurrence, 20 patients underwent pathological evaluation. Finally, sixteen patients (19.8%) confirmed locoregional recurrences in study B either by pathologically or clinically with follow-up imaging studies. Our results showed that SUVmax at staging workup (study A) did not correlate with recurrence. However, post-radiation SUVmax at follow-up was significantly higher in patients with locoregional recurrence compared with non recurrent patients for primary tumor and nodes (p < 0.001) (Fig. 3). The mean SUVmax of 65 patients with non recurrent disease was 3.22. The percentage of non-recurrent patients with SUVmax ≤ 4.5 was 86.1%. The mean SUVmax of 16 patients with locoregional recurrence was 7.59. Using logistic regression, post-radiation SUVmax was significantly correlated with locoregional recurrence. As the value of SUVmax increased, the probability of locoregional recurrence increased (HR,1.812; 95% CI, 1.361 to 2.413; p < 0.001) (Fig. 4). From our results, SUVmax from follow-up PET/CT imaging was significant independent predictor for locoregional recurrence in patients with postoperative radiotherapy with or without chemotherapy.

Maximal standardized uptake value (SUVmax) distribution for recurrent patients and non-recurrent patients (study B). Histogram plots of post-radiation SUVmax value are shown for locoregional site. NED, no evidence of disease.
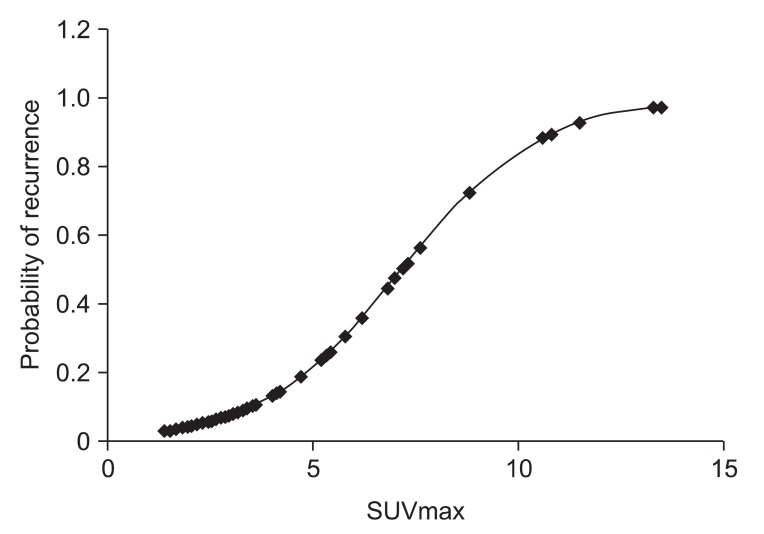
A Binominal logistic regression curve for post-radiation maximal standardized uptake value (SUVmax) value is shown. Locoregional recurrence probability in patients after postoperative adjuvant radiotherapy increases by SUVmax value from follow-up positron emission tomography/computed tomography imaging (hazard ratio, 1.812; 95% confidence interval, 1.361 to 2.413; p < 0.001).
4. Diagnostic accuracy of follow-up PET/CT for detecting locoregional recurrence
ROC curve analysis was performed on the follow-up PET/CT data to determine the SUVmax values with highest accuracy for postoperative radiotherapy failure (Fig. 5). We identified 5.38 as the cut-off value with maximal accuracy for detecting locoregional recurrence. Using this cut-off value, sensitivity, specificity, PPV, and NPV were calculated. The accuracy of follow-up PET/CT for detecting locoregional recurrence is shown in Table 4. The NPV (93.7%) of follow-up PET/CT was relatively higher than the PPV (66.7%) for the detecting of post-radiation locoregional recurrence.

Receiver operating characteristic (ROC) curve for post-radiation positron emission tomography/computed tomography is shown (area under ROC curve, 0.901; 95% confidence interval, 0.806-0.996; p < 0.001).
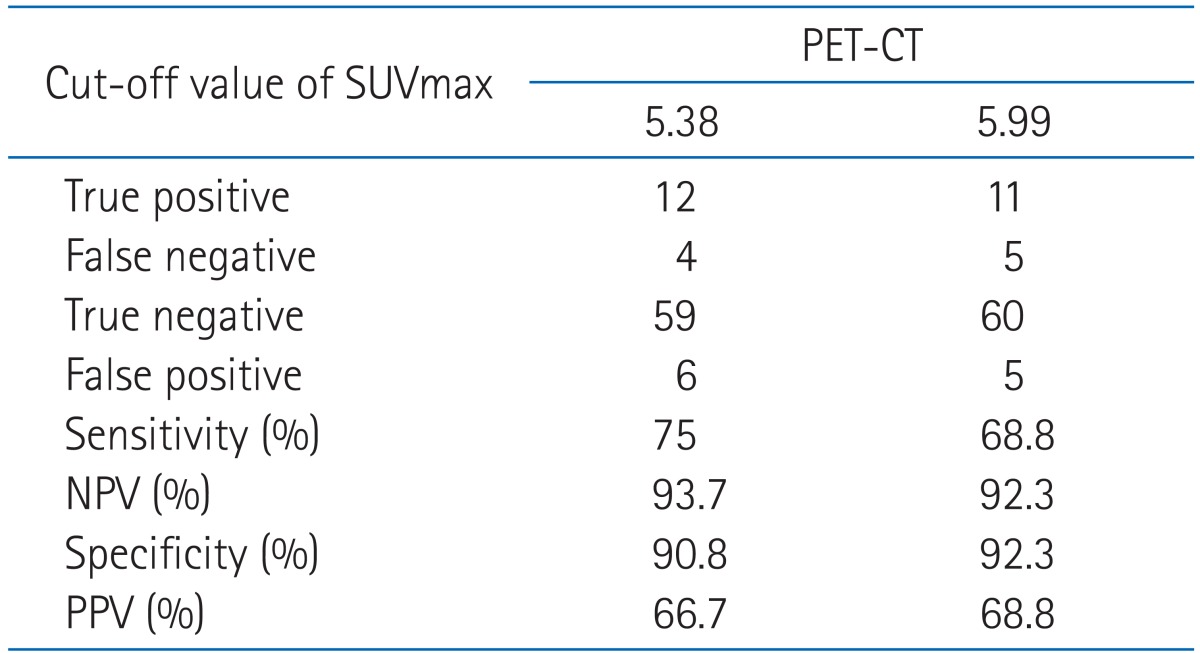
Accuracy of PET-CT detecting locoregional recurrence in patients with postoperative radiotherapy or chemoradiotherapy
Discussion and Conclusion
Recent studies have evaluated whether values from initial PET/CT predict treatment outcome in head and neck cancer [9-11,17,18]. Several studies have shown high SUVmax at staging workup predict poor outcome in head and neck cancer [11,17,19]. Despite such findings, our results did not confirm SUVmax as predictor of outcome. Other investigators have also not found any significant correlation SUVmax with treatment outcome in head and neck cancer [9,10,20], whereas MTV from PET/CT has been suggested as prognostic factor in head and neck cancer. La et al. [10] found that high MTV from PET/CT in locally advanced head and cancer correlate with short DFS. Chung et al. [9] also confirmed patient with MTV > 40 mL showed a poor treatment outcome including recurrence by multivariate analysis. To our knowledge, the current study is the first to evaluate MTV as predictor of treatment outcome in HNSCC patients treated with postoperative adjuvant radiotherapy. In our results, patients with MTV > 41 mL showed short DFS and 2.4-fold higher recurrence or death than patients with MTV ≤ 41 mL. Presence of vascular invasion and extracapsular spread also correlated with short DFS by univariate analysis. Because several patients had no information for their vascular invasion and extracapsular spread status, we could not secure sufficient data for multivariate analysis. Prospective and well-controlled study is needed to determine MTV or SUVmax as predictor of outcome in head and neck cancer.
We also evaluated diagnostic accuracy of PET/CT to detect postoperative radiotherapy recurrence focused on primary site and regional lymph nodes. In the assessment of response and detection of recurrence for head and neck cancer, there are increasing recent data [5-7,12,20]. Moeller et al. [20] showed higher SUVmax in non-responder compared with responder. Our results also showed higher SUVmax at follow-up was significantly associated with locoregional recurrence. From this, we calculated diagnostic accuracy of PET/CT using SUVmax at the first timing of suspected recurrence. Although initial SUVmax may be not predictor of recurrence, this can be objective and useful value for detecting treatment recurrence with cut-off value of 5.38 during post-treatment follow up. We identified NPV as 93.7% and PPV as 66.7% in the postoperative radiotherapy setting. In the recent two studies investigating the performance of PET/CT after concurrent chemoradiotherapy, locoregional NPV and positive PPV from 96.1% to 100% and from 42% to 58.3%, respectively [7,20]. Our cut-off value as 5.38 of locoregional site was lower than the study of Moeller et al. [20] as 6.5 of primary site, moreover showed relatively accurate performance of PET/CT using SUVmax value. Because those used PET/CT data set performed within 12 weeks after treatment, could show relatively lower PPV and higher cut-off value than our results. Timing of PET/CT after treatment was critical for diagnostic accuracy of treatment outcome. Other studies showed that PET/CT performed within 12 weeks after definitive radiotherapy had false positive or false negative case [13,21]. In our study, six non-recurrent patients had persistent higher SUVmax than cut-off value as 5.38 (median SUVmax, 7.1). Primary sites of these were oral cavities (three patients), larynx (two patients) and nasal cavity (one young patient). The median duration of PET/CT in these patients was 52.5 weeks after postoperative radiotherapy. Though none of them undertook PET/CT within less than 8 weeks, they had persistent high SUVmax value. Therefore, our results showed that false positive could be persistent for the long term period in patients treated with postoperative radiotherapy.
Same as recent other studies, the current study had also issue for false positive findings of PET/CT in the post-treatment settings. Diagnostic accuracy of follow-up PET/CT could improve in patients with adverse prognostic factors such as HPV-negative tumors and non-oropharyngeal cancer. In the study of Moeller et al. [20], PPV in the high risk patients as HPV-negative, non-oropharyngeal cancer, and smoking history was 100%. No benefit of PET/CT for low-risk patients suggested need for stratifying patients by risk group in the follow-up. The current study suggested that high MTV could be a possible prognostic factor of HNSCC patients. In the further prospective study, we can expect more confident PPV in patients with high MTV.
There are several limitations in the current retrospective study. First, more patient accrual needs to increase statistical power. Because routine staging workup did not include PET/CT before 2001, we divided patients into study A and B according to presence of initial PET/CT data set. Only limited number of recurrence in each variant group made insignificant results from multivariate analysis. Second, timing of follow-up PET/CT is another limitation. Although we chose PET/CT data set based on clinicopathological data as physical examination and supportive images, SUVmax value from first suspected recurrence had inherent bias. However, this process may simulate usual clinical practice setting and our result can be usefully applied in appropriate clinical decision. In the current study, we focused on patients treated with excision and neck dissection and measured SUVmax in postoperative tumor bed and dissected neck region. Thus, we did not separate diagnostic accuracy in primary site and lymph nodes in contrast to other investigators [20,22]. Finally, because of the retrospective nature of this study, irregularity of PET/CT follow-up is associated with inherent biases.
In conclusion, results of current study confirm that MTV at staging workup is significantly associated with treatment outcome. At higher than locoregional SUVmax 5.38 from follow-up PET/CT, we can suspect disease recurrence of postoperative irradiated HNSCC. Although high false positive rate in the postoperative irradiated head and neck was noted, follow-up PET/CT was proved to be a useful tool for detecting of locoregional recurrence. We can expect more confident results through further prospective study and comparison with other imaging modalities.
Notes
No potential conflict of interest relevant to this article was reported.