


Introduction
Lung cancer is the most common cancer and a leading cause of cancer death globally [1]. In about 85% cases, lung cancer is diagnosed as non-small cell lung cancer (NSCLC) [2]. In NSCLC, 20%вҖ“25% of patients are diagnosed with locally advanced disease (stages IIIA and IIIB according to the American Joint Committee on Cancer [AJCC] 7th edition) [3]. Patients with inoperable locally advanced NSCLC have a poor prognosis, with a 5-year survival rate of 15%вҖ“25% [4].
For locally advanced NSCLC, multimodality treatment is used. Patients with resectable stage IIIA NSCLC undergo surgery or neoadjuvant chemotherapy/chemoradiotherapy. The standard treatment of unresectable locally advanced NSCLC is definitive concurrent chemoradiotherapy (CCRT) [5]. Despite multimodality treatment, local and distant failure is high in unresectable locally advanced NSCLC. Thus, there is a need to determine the prognostic and predictive factors in locally advanced NSCLC to improve treatment strategy.
The prognostic and predictive factors of NSCLC are known as disease stage, performance status, sex, age, histology, tumor size, and mediastinal infiltration [2]. Recently, routinely assessed biological variables, such as neutrophil-to-lymphocyte ratio (NLR), platelet-to-lymphocyte ratio (PLR), and leukocytosis have been suggested as the prognostic factors [3,6-13]. Templeton et al. conducted a meta-analysis of 100 studies with a total of 40,599 patients and they demonstrated that a high NLR is associated with poor overall survival (OS) in many solid tumors [6]. Another meta-analysis of 20 studies with 12,754 patients showed that high PLR is associated with poor OS in various cancers [7]. Several studies have shown that NLR and PLR are associated with the prognosis in patients with stage IвҖ“IV NSCLC [3,6,10-12]. However, previous studies had heterogeneity in stage and treatment modalities.
This study aimed to evaluate the prognostic and predictive value of NLR and PLR in patients with locally advanced NSCLC with CCRT as first-line treatment.
Materials and Methods
1. Patients
We retrospectively analyzed 66 patients with locally advanced NSCLC treated with CCRT between 2008 and 2017 at our hospital. The inclusion criteria were as follows: (1) new diagnosis of stage IIIA or IIIB NSCLC according to the 7th edition of the TNM classification of the AJCC, (2) histologically confirmed NSCLC, (3) Eastern Cooperative Oncology Group (ECOG) performance score of 0вҖ“2, and (4) lymphocyte and neutrophil counts performed before and after CCRT. The exclusion criteria were as follows: (1) received induction chemotherapy; (2) non-completion of the planned treatment and treatment of вүӨ50 Gy, (3) history of hematologic malignancies or chemotherapy for other diseases, and (4) evidence of acute infection. A total of 66 patients met the inclusion/exclusion criteria and received definitive CCRT as the first-line treatment. This study was approved by the Institutional Review Board of Seoul St. MaryвҖҷs Hospital (No. KC19RESE0254).
2. Chemotherapy
CCRT consisted of weekly chemotherapy using paclitaxel/carboplatin (PC), docetaxel/cisplatin (DP), docetaxel/carboplatin, and etoposide/cisplatin. PC was administered to 37 patients (56.1%), and DP was administered to 26 patients (39.4%). PC chemotherapy was performed with carboplatin (area under the curve [AUC] = 2) and paclitaxel (50 mg/m2) administered on a weekly schedule during CCRT. Docetaxel 20 mg/m2 and cisplatin 20 mg/m2 were administered concomitantly with a weekly schedule.
3. Radiotherapy
Radiotherapy was performed with intensity-modulated radiotherapy or three-dimensional conformal radiotherapy. The gross tumor volume (GTV) included both primary lung mass and involved lymph nodes visible on imaging (вүҘ1 cm on CT and/or PET-CT) or histologically proven nodes by endobronchial ultrasound (EBUS) or endoscopic ultrasound (EUS). The clinical target volume (CTV) was defined as an extension of 5 mm in all directions of the GTV. The planning target volume (PTV) was generated by expanding an additional margin (generally 5вҖ“10 mm) to the CTV for the setup error and respiratory movement according to the assessment in four-dimensional CT. Elective nodal irradiation was not allowed. The median radiation dose was 66 Gy in 33 fractions (range, 52 to 72.6 Gy).
4. NLR and PLR
The pre-CCRT NLR and PLR were calculated from the nearest complete blood count (CBC) within 1 week before the start of CCRT. The post-CCRT NLR and PLR were calculated 4 weeks after CCRT. When CBC was performed several times after CCRT, it was calculated using the CBC values nearest to the 4 weeksвҖҷ time interval from the end of the CCRT. For patients who underwent consolidation chemotherapy after CCRT, post-CCRT NLR and NLR were calculated using CBC before consolidation chemotherapy. NLR change was calculated by dividing the post-CCRT NLR by the pre-CCRT NLR. The PLR change was also calculated by dividing the post-CCRT value by the pre-CCRT value.
5. Response and follow-up
The treatment response was evaluated by Response Evaluation Criteria In Solid Tumors (RECIST) criteria. Locoregional progression was defined as progressive disease in the ipsilateral lung, both mediastinal lymph nodes, and both supraclavicular regions. Distant metastasis was defined as any metastasis outside the chest and contralateral lung.
6. Statistical analysis
The maximally selected log-rank test was used to acquire the most significant NLR and PLR level related with OS. Continuous variables were analyzed using the independent t-test or Mann-Whitney U test, and categorical variables were analyzed using the chi-square test. We primarily evaluated the OS difference according to NLR and PLR cutoff level and also observed the difference in locoregional progression-free survival (LRPFS) and distant metastasis-free survival (DMFS). The OS, LRPFS, and DMFS were calculated from the first day of CCRT to the date of death, locoregional recurrence, and distant metastasis or most recent follow-up visit using the Kaplan-Meier method. Univariate analysis was performed using the log-rank test including all patients, tumor related factors, and hematological parameters. The significant variables on univariate analysis were evaluated on multivariate analysis. Multivariate analysis was performed including the lymphocyte-related hematological parameters to eliminate collinearity between the parameters, using Cox proportional hazard model (method, forward). All tests were two-sided, and p-values of <0.05 indicated statistical significance. All statistical analyses were performed using R version 3.5.3 (R Development Core Team, Vienna, Austria).
Results
1. Patient characteristics
PatientsвҖҷ characteristics are shown in Table 1. The median age was 64 years (range, 40 to 78 years), and most patients were male (84.8%). There were 23 patients (34.8%) with stage IIIA, and 43 patients (65.2%) with stage IIIB. A total of 33 patients (50.0%) were diagnosed with squamous cell carcinoma, and 29 patients (43.9%) were diagnosed with adenocarcinoma. Moreover, 37 patients (56.1%) received PC chemotherapy, and 26 patients (39.4%) received DP chemotherapy. Most patients (95.5%) had ECOG performance status 0вҖ“1. The median pre-CCRT NLR, post-CCRT NLR, and NLR change were 2.7 (range, 1.03 to 16.03), 3.0 (range, 0.74 to 44.62), and 1.2 (range, 0.05 to 11.02), respectively. Furthermore, the median pre-CCRT PLR, post-CCRT PLR, and PLR change were 145.5 (range, 75 to 453), 172.5 (range, 38 to 898), and 1.1 (range, 0.33 to 7.18), respectively.
2. Cut-off values of NLR and PLR
The maximally selected log-rank test was performed to determine optimal cutoff values of NLR and PLR that predict OS. According to the results of the statistics, the optimal cutoff levels were 1.64, 3.12, and 1.61 for the pre-CCRT NLR, post-CCRT NLR, and NLR change. Moreover, the optimal cutoff levels were 115, 141, and 1.67 for the pre-CCRT PLR, post-CCRT PLR, and PLR change. The survival analysis was performed by dividing the patients into two groups based on NLR change (вүӨ1.61 or >1.61) which is most significant for treatment outcome.
Radiation dose, PTV volume, post-CCRT NLR, post CCRT PLR, and PLR change were statistically different between the two NLR change groups. The high NLR change group had higher radiation dose and larger PTV volume than those in the low NLR group (p = 0.035 and p = 0.024, respectively). The levels of post-CCRT NLR, post-CCRT PLR, and PLR change were higher in the high NLR change group (all p < 0.001) (Table 1).
3. OS, LRPFS, and DMFS according to NLR and PLR
The median follow-up duration was 15.4 months (range, 1.5 to 87.7 months). The 1- and 2-year OS rates were 66.7% and 48.1%, respectively. The post-CCRT NLR, PLR and NLR change were significantly associated with OS on univariate analysis. The high post-CCRT NLR group showed significantly worse OS compared to the low NLR group (2-year OS: 25.8% vs. 68.2%, p < 0.001). Moreover, the high post-CCRT PLR had worse OS than the low PLR group (2-year OS: 37.5% vs. 71.1%, p = 0.004). The high NLR change group had worse OS than the low NLR change group (2-year OS: 26.0% vs. 59.0%, p < 0.001). The Kaplan-Meier survival curves for OS according to NLR and PLR are shown in Fig. 1.
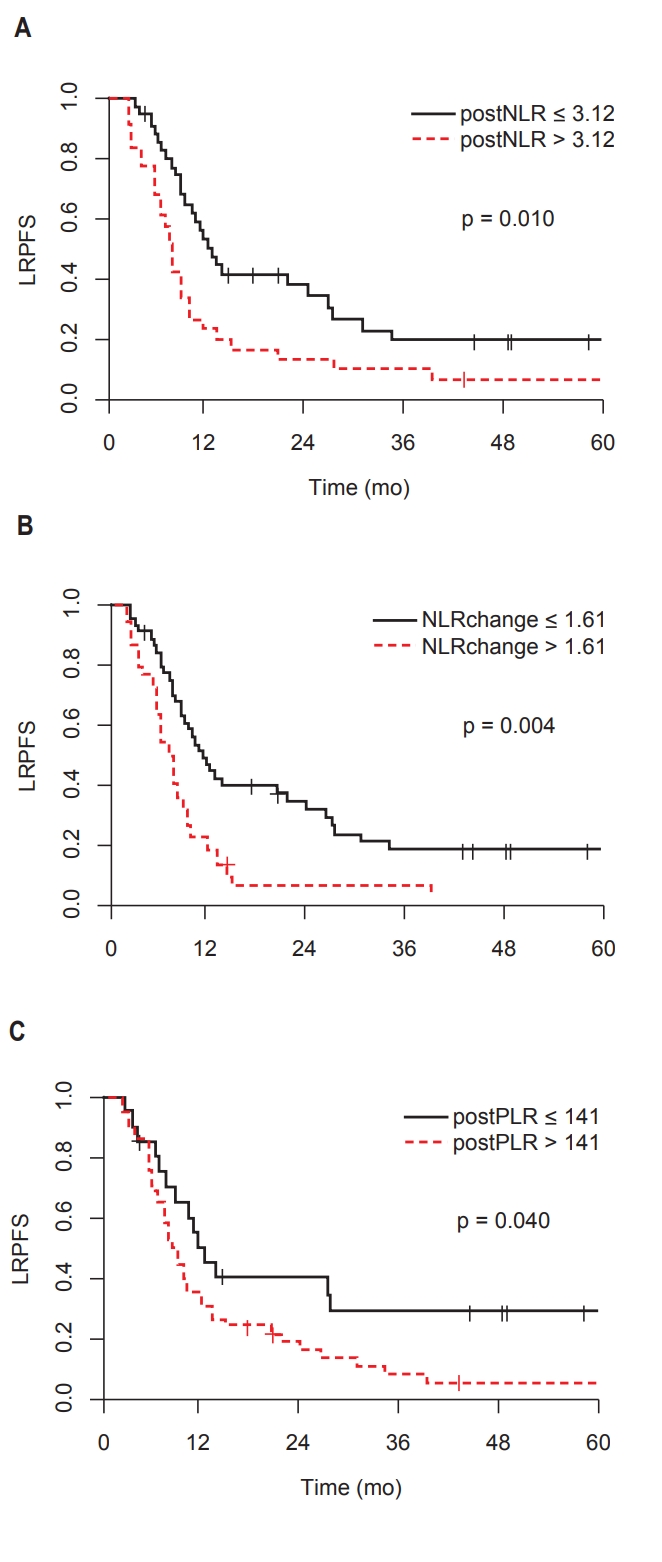
The 1- and 2-year LRPFS rates were 37.0% and 23.8%, respectively. The post-CCRT NLR, PLR, and NLR change were significantly associated with LRPFS. The high post-CCRT NLR group showed significantly worse LRPFS compared to the low NLR group (2-year LRPFS: 12.9 vs. 33.8%, p = 0.010). The high post-CCRT PLR group had worse LRPFS than the low PLR group (2-year LRPFS: 16.5% vs. 40.3%, p = 0.040). The high NLR change group had worse LRPFS than the low NLR change group (2-year LRPFS: 6.8% vs. 31.8%, p = 0.004). The Kaplan-Meier survival curves for LRPFS according to NLR and PLR are shown in Fig. 2.
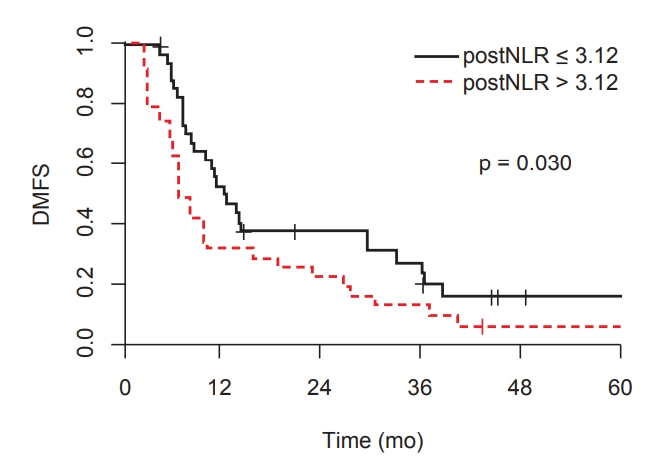
The 1- and 2-year DMFS rates for all patients were 43.2% and 30.5%, respectively. The high post-CCRT NLR was significantly associated with worse DMFS. The median DMFS for high post-CCRT NLR group was 6.9 months compared with 12.2 months for low NLR group (p = 0.030) (Fig. 3).
4. Prognostic factor
We performed a univariate analysis to identify the prognostic factor for OS and LRPFS. Univariate analysis showed that PTV volume, post-CCRT NLR, post-CCRT PLR, and NLR change were significantly associated with OS (Table 2). Age, gender, stage, ECOG, pathology, chemotherapy regimen, other inflammatory marker (ESR, CRP, and LDH), pre-CCRT NLR, and PLR were not associated with OS. The PTV volume (hazard ratio [HR] = 2.05; 95% confidence interval [CI], 1.08вҖ“3.90; p = 0.028) and NLR change (HR = 3.17; 95% CI, 1.16вҖ“8.69; p = 0.025) were found as the significant prognostic factors for OS in the multivariate analysis (Table 3).
Discussion and Conclusion
Recent studies have shown that inflammation-related biomarkers were correlated with prognosis in many solid cancers such as colorectal cancer, hepatocellular carcinoma, and NSCLC [3,6-13]. Among inflammation-related biomarkers, NLR and PLR are affordable and easily available markers using CBC.
The correlation of NLR with survival rate could be explained by tumor-related inflammation and immunity [3,10,14-16]. NLR is calculated by dividing neutrophils into lymphocytes, which reflect neutrophilia or lymphopenia. Emerging evidence of animal models showed that a tumor causes neutrophilia by upregulating granulocyte-colony stimulating factor (G-CSF) and granulocyte-macrophage-colony stimulating factor (GM-CSF) [14]. Neutrophils promote tumor growth through several mechanisms. One mechanism is angiogenesis by BV8 and vascular endothelial growth factor (VEGF) stimulated by neutrophils [15,16]. Another mechanism of pro-tumorigenic effects of neutrophils is inhibiting apoptosis [10]. Lastly, tumor-associated chronic inflammation leads to DNA damage by reactive oxygen species (ROS) or reactive nitrogen species (RNS) [17]. Platelet is also known to be associated with tumor growth, angiogenesis, and metastasis [7,18].
Neutrophils and lymphocytes participate in the regulation of adaptive immunity. Neutrophils express inducible nitric oxide synthase (iNOS) or arginase 1 (ARG1) and inhibit CD8+ T cell-mediated anti-tumor immunity [14]. Lymphopenia means the low number of T cell lymphocytes resulting in poor lymphocyte-mediated immune response to the tumor [3].
Previous studies have reported the use of NLR as a prognostic factor for NSCLC. Yin et al. [11] performed a meta-analysis of 14 studies with 2,734 cases to investigate the prognostic role of NLR in lung cancer. They demonstrated that elevated NLR showed worse OS in NSCLC (HR = 1.192; 95% CI, 1.061вҖ“1.399) and SCLC (HR = 1.550; 95% CI, 1.061вҖ“2.077). This study includes all stages of NSCLC and different treatment methods.
The results of the stage III NSCLC study are as follows: Scilla et al. [10] reported that baseline NLR was a significant prognostic factor in patients with stage IIIA and IIIB NSCLC who received CCRT with or without surgery. Using cutoff point 5, there was a difference in survival rate (median OS: 26 vs. 11 months; p < 0.0001). Tong et al. [3] also analyzed stage III NSCLC treated with CCRT or surgery followed by CRT. They found that patients with pre-treatment NLR вүҘ3.57 had a significantly worse OS (5-year OS: 20% vs. 8.8%, p < 0.001). The abovementioned studies include some patients who underwent surgery as well as CCRT. In this study, we investigated the prognostic significance of the NLR in patients who received definitive CCRT and exclude treatment-related bias as less as possible.
A recent phase III trial added anti-programmed death ligand 1 (PD-L1) antibody durvalumab as consolidation therapy for patients with stage III NSCLC who did not have disease progression after definitive CCRT [19]. Suh et al. [12] reported post-treatment NLR at week 6 was a prognostic marker in patients with advanced NSCLC treated with anti-PD-1 antibody. In a study by Khunger et al. [20], high post-treatment NLR after 2 cycles of nivolumab was associated with worse OS.
In this study, post-CCRT NLR, post-CCRT PLR, and NLR change were significant prognostic factors for OS and LRPFS on the univariate analysis. However, age, stage, and ECOG performance status were not associated with survival. Even having the limitation of a retrospective study, the patients in our study had relatively homogeneous stage and ECOG performance status.
The PTV volume and NLR change were the significant prognostic factors for OS in the multivariate analysis. Large tumor volume may indicate treatment resistance and a high probability of metastasis [21]. A previous study reported that radiation could affect circulating lymphocytes and cause lymphopenia [22]. In this study, PTV volume was larger in the high NLR change group than in the low NLR change group. It might be that the circulating neutrophils and lymphocytes were affected by the irradiated volume. However, there was no statistically significant correlation between PTV volume and absolute lymphocyte count after CCRT (r = -0.138, p = 0.270). Furthermore, there was no significant correlation between PTV volume and absolute neutrophil count after CCRT (r = 0.144, p = 0.247).
The results of the previous studies and this study showed that chronic inflammation plays a role in the resistance of chemoradiation treatment. NLR change between pre- and post-treatment are believed to indicate systemic inflammation and immune status reflecting the therapeutic effect. Despite high NLR before treatment, the patients whose NLR became low after treatment had better prognosis than the patients whose NLR remained high after treatment. Cannon et al. [23] suggested that PLR may be used in selecting adjuvant systemic treatment for early-stage lung cancer. We believe that patients with high NLR after treatment need frequent follow-up and aggressive adjuvant treatment.
Although NLR has been shown to be associated with patient survival, the cutoff point was so diverse. The range of cutoff points of NLR was from 2.5 to 5 according to a meta-analysis [6]. Our cutoff point for NLR change was 1.61. It is difficult to determine a reference point that can be clinically used; therefore, further studies are needed to confirm optimal cutoff values.
The limitations of our study were its retrospective single-institution design and small number of patients. Moreover, NLR could be affected by other conditions such as treatment-related toxicity. We used 4 weeks after treatment to exclude transient hematologic toxicity, but we cannot rule out that all effects are excluded. Thus, large multi-institutional studies are required to confirm the relationship between NLR and prognosis.
Therefore, we showed that NLR change was most significantly associated with OS in patients with locally advanced NSCLC treated with definitive CCRT. The elevated NLR after treatment may predict the patients at high risk of treatment failure.